Zakaria Bustami
Contents
Biodata diri
Nama: Zakaria Bustami
NPM: 1806228101
Tempat/Tanggal Lahir: Balikpapan, 17 Desember 1999
Saya merupakan mahasiswa Fakultas Teknin Universitas Indonesia Teknik Mesin Kelas Khusus Internasional angkatan 2018. Saat ini saya sedang menempuh semester 6 perkuliahan. Mimpi saya menjadi seorang insinyur teknik mesin dimulai dari kebiasaan ayah saya mengunjungi pelabuhan udara di kota tempat lahir saya. Dari sini lah, tumbuh rasa ingin tahu yang besar terhadap dunia penerbangan. Di masa depan, saya ingin melanjutkan visi salah satu inovator terkenal dari negara kita. Yaitu pak B.J. Habibie.
Selasa, 23 Februari 2021
Hari ini merupakan kelas pertama Energy Conversion System 02. Kabar saya baik dan sehat, secara rohani maupun jasmani.
Hari ini kita berdiskusi tentang apa arti keadilan sosial. Menurut saya keadilan merupakan suatu hak mendasar yang harus dimiliki seorang manusia. Memang tidak dapat dipungkiri, keadilan sosial tidak akan tercipta seutuhnya. Namun sebagai anggota masyarakat, seharusnya kita memajukan upaya-upaya untuk mengurangi ketidakadilan yang terjadi di masyarakat. Pendidikan merupakan salah satu cara untuk memajukan tujuan ini. Dengan pendidikan masyarakat dapat menciptakan inovasi-inovasi yang dapat mengurangi ketidakadilan. Menurut saya, kita sebagai insinyur teknik mesin dapat mengaplikasikan ilmu-ilmu yang didapat untuk mengurangi keadilan. Contohnya, ketika belajar ilmu mekanika fluida dan sistem fluida, kita belajar tentang sistem piping dan pompa. Ilmu sederhana itu bisa kita gunakan untuk memberikan akses air bersih kepada masyarakat terpencil, atau membantu penanggulangan banjir di jakarta. Masih banyak ilmu praktis yang dapat digunakan dalam membantu masyarakat luas. Contohnya ada ilmu mekanika dan statika struktur yang dapat digunakan membuat struktur sederhana yang dapat membantu orang pedesaan.
Hal lain yang kita diskusikan adalah energi. Lebih tepatnya, bagaimana kita menjelaskan konsep energi ke anak yang duduk di tingat SD. Jika saya menjelaskan ditanya oleh seorang anak kecil tentang apa itu arti energi, maka saya akan menjawab "Energi itu seperti berapa jauh kamu bisa nendang bola. Kalau kamu bisa menendang bola dengan jauh, maka energi kamu besar. Tapi kalau bolanya ditendang sama adek kamu yang masih bayi, bolanya ditendang tidak jauh. Berarti energi adek kamu kecil". Menurut saya seharusnya mereka bisa menegerti, mengingat banyak anak yang dari kecil sudah disuguhkan mainan berupa bola.
Rabu, 24 Februari 2021
Assignment 1
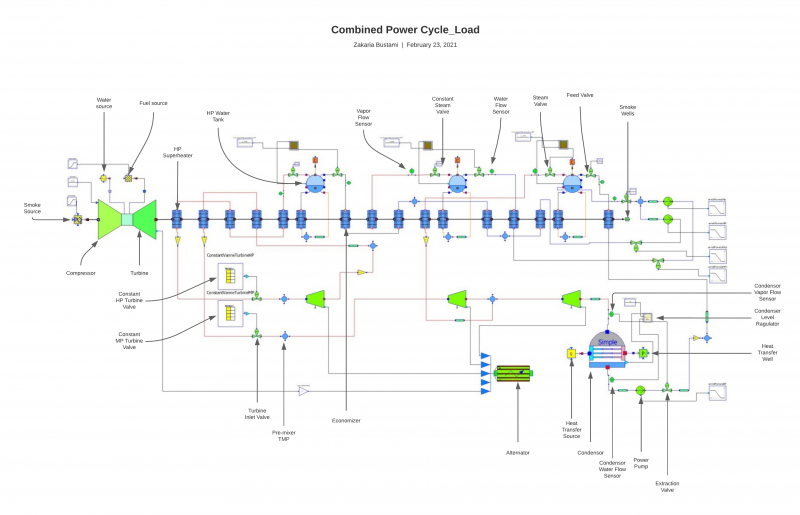
Gambar di bawah menunjukkan diagram combined power cycle dengan anotasi untuk setiap komponennya
Dari gambar di atas, dapat kita lihat bahwa komponen-komponen yang terdapat antara lain adalah:
1) Compressor
2) Turbine
3) Water source
4) Fuel source
5) Smoke source
6) Superheater
7) Constant turbine valve
8) Water tank
9) Turbine inlet valve
10) Pre-mixer
11) Economizer
12) Flow sensors
13) Constant steam valve
14) Steam valve
15) Feed valve
16) Smoke wells
17) Alternator
18) Condensor
19) Condensor water flow sensor
20) Power pump
21) Extraction valve
22) Heat transfer well
23) Extraction valve
24) Condensor vapor flow
Walaupun hampir semua komponen sudah di identifikasi, namun harus dilakukan pendalaman magteri terkait operasi sistem siklus daya dengan konfigurasi di atas.
Sunday, 28 February 2021
Experimentation #1: Modeling of an open-cycle gas turbine
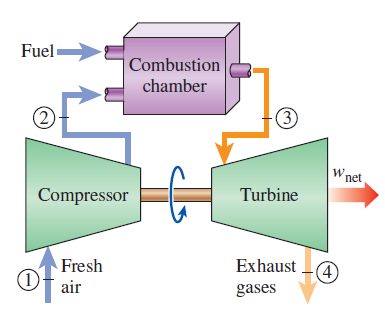
A gas turbine works based on a principle which was named after its inventor, George Brayton, who first proposed its use in the reciprocating oil-burning engine that he developed around 1870. Nowadays, it is used for gas turbines where where both the compression and expansion process is situated within the rotating machinery (Çengel, 2019). Gas turbines usually operates on an open-cycle. In this process, fresh air at ambient condition is drawn into the compressor, where its temperature and pressure is raised. The high pressure gas then proceeds into the combustion chamber, where an the air and fuel mixture is burned at a constant pressure. The high temperature gas then enter the turbine, where it expands to atmospheric pressure while subsequently converting its enthalpy into power. The exhaust gas then leaves the turbine without being re-circulated, completing the open-cycle loop.
The process called the Brayton Cycle, can be summarized into 4 internally reversible process:
1-2 Isentropic compression (in a compressor)
2-3 Constant-pressure heat addition
3-4 Isentropic expansion (in a turbine)
4-1 Constant-pressure heat rejection
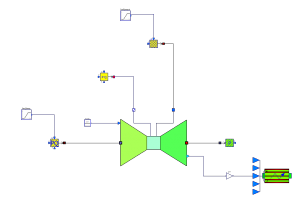
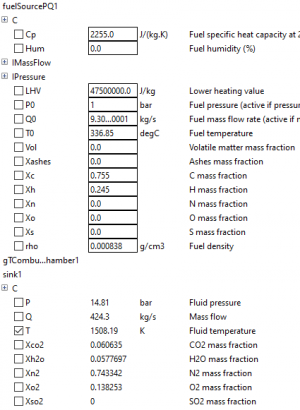
Using openModelica, we can model a simple system which can simulate the power output of a single stage open-cycle gas turbine. In this case, the ThermoSysPro built-in library contains of all the necessary components to create this system. The completed system can be seen in Figure 2. The system requires 4 distinct inputs, where 2 of which defines the mass flow and humidity of the inlet gas. The other 2 inputs characterize the type of fuel and mass flow of the oxidizer respectively. On the other side of the system, there are also 2 distinct output. The first output defines the exhaust of flue gas flowing out of the turbine. Because it is an open-cycle gas turbine, it's necessary that we define the flue gas exhaust. Or the simulation will fail because the number of equations needed to be solved exceeds the number of variables. The last output is connected into the generator, which tells us how much electrical power is generated from the system.
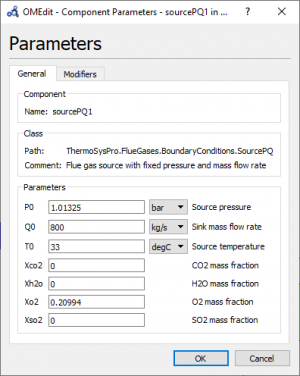
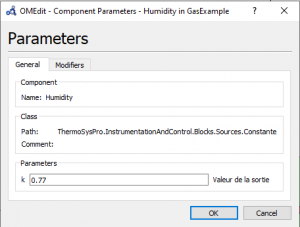
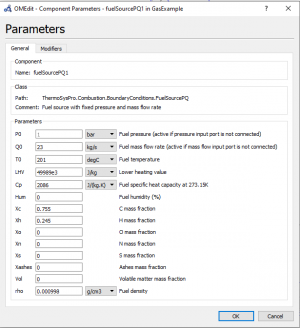
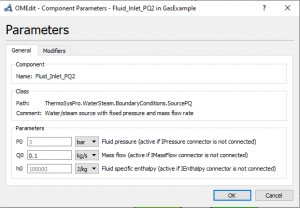
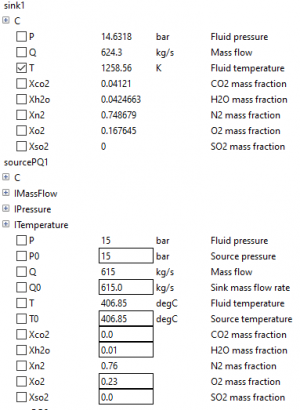
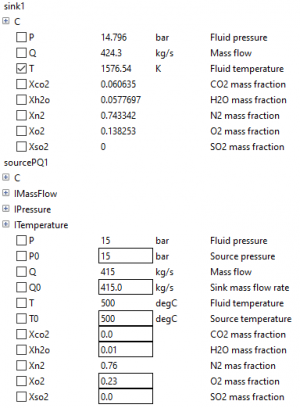
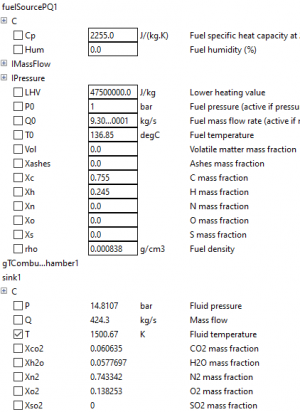
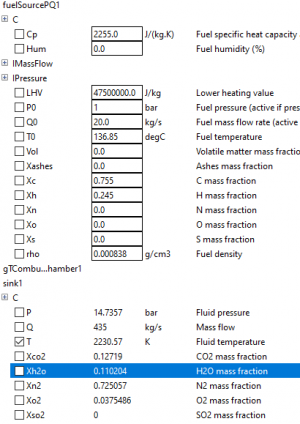
The parameters for each respective inlet can be seen below:
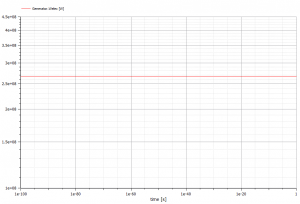
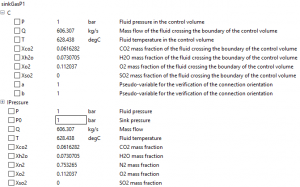
After successfully running simulation, we can extract data including the parameter of the exhaust flue gas as well as the power generated by the system. The summary of these can be seen below:
March 7th, 2021. Investigation of a gas power cycle on a per-component basis
a) Compressor and Turbine
Compressor or pump is a device that is used to alter the state of a substance by doing work on the substance, usually to increase it's temperature or pressure. The term compressor is used when the working fluid is gas (vapor) and the term pump is used when the working fluid is liquid. Compressors and pumps requires a power input to do its function. A turbine on the other hand, convert the energy from a hot moving fluid and outputs power. The process in both types of machines are usually adiabatic since the heat transfer effect is usually too small for it to be significant. Because it is also reversible, it means that it is an isentropic process. If we create a control volume enclosing the compressor, we get a mass and energy balance at steady state for both systems where:
dE/dt = Q - W + m(h1-h2) = 0
W = Q + m(h1-h2)
where,
dE/dt = The time rate of change of the energy contained within the system at time t
Q = Net rate of energy being transferred in to the system by heat transfer at time t
W = Net rate of energy being transferred out of the system by work at time t
whereas the relation between the pressure and temperature within the isentropic process can be described mathematically as:
T2/T1 = (P2/P1)^(k-1/k), where k = Cp/Cv
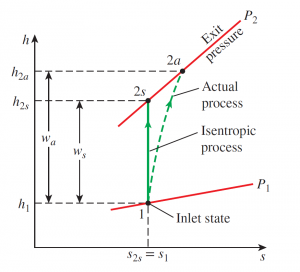
Although we can idealize the compression and expansion analysis of gasses flowing trough the compressor and turbine as a completely adiabatic and reversible process, the reality differ slightly from these initial assumptions. In reality there are always going to be irreversibilities that accompany every process which downgrades the performance of the machine. In Fig. 1 we can see that the actual and isentropic (idealized) process differs. The more closely the actual process approximates the idealized one, the better the machine performs. A parameter which can help us determine this is the isentropic or adiabatic efficiency, which is a measure of the deviation of the actual processes to the idealized ones. It is important to remember that the isentropic efficiency is different for each machines.
The isentropic efficiency of a compressor is defined as as the ratio of the work input required to raise the pressure of a gas to a specified value in an isentropic manner to the actual work input
nc = isentropic compressor work/actual compressor work = ws/wa
Notice that the isentropic compressor work input is located at the numerator instead of the denominator. This implies that since the efficiency cannot be greater than 100%, the isentropic work is actually smaller than the actual work. Thus, if changes in kinetic and potential energy becomes negligible, the isentropic efficiency of the compressor can be closely approximated as
nc = h2s-h1/h2a-h1
Whereas the isentropic efficiency of turbines is defined differently than that of the compressor. Where:
nt = actual compressor work/isentropic compressor work = wa/ws = h1-h2a/h1-h2s
Effect of Inlet Parameters on a Gas Turbine Combustion Chamber
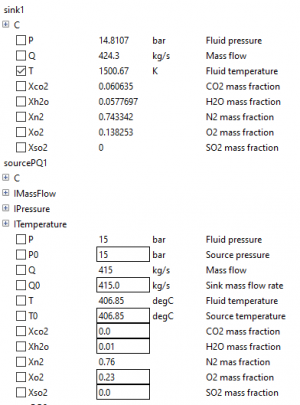
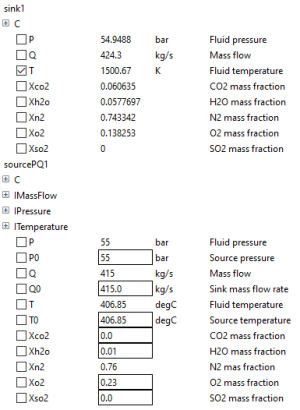
The effect of inlet parameters on a open GT combustion chamber is investigated using computational modeling with the help of OpenModelica. There are 3 groups of inlet parameters which regulates flue gas, fuel, and water/steam parameters into the combustion chamber. The purpose of this investigation is to inspect the effect of inlet mass flow rate, temperature, and pressure to the outlet flue gas parameters. The model is first run at a reference value. After obtaining a reference result, individual parameters is then changed to a higher/lower value to the reference. The result is then plotted and compared to the reference result. This way, we can observe the effect of changing individual parameters to the overall result of the simulation.
The result of altering of the inlet flue gas parameters can be seen above. It can be seen that by increasing the inlet pressure, the outlet flue gas pressure also increases significantly. Despite this however, the temperature and mass flow rate is the same with the reference value. In the second simulation, we observe a considerable effect on the outlet mass flow rate and temperature. The most obvious effect is the increase in the outlet mass flow rate. Another considerable effect that we observe is a significantly lower outlet temperature. By increasing the inlet mass flow by 48%, the outlet temperature decreases by 16%. The last simulation changes the inlet temperature of the combustion chamber. We see an obvious increase here where the outlet temperature also increases by 5%.
When investigating the effect of fuel source inlet parameters on the combustion chamber, the characteristic is almost similar to the flue gas investigation. The most significant founding from the simulation is that the outlet temperature of the flue gas is significant affected by the fuel mass flow rate. In our investigation, the outlet temperature increases by almost 50% when we increase the fuel mass flow by 115%
