Analisis aliran didalam Cyclone Separator dengan Simulasi CFD menggunakan CFDSOF
Analisis aliran didalam Cyclone Separator dengan Simulasi CFD menggunakan CFDSOF Abstrak
Contents
Introduction
Abi Rizky
Cyclone separators or simply, cyclones, are separation devices which use the principles of inertia to remove particulate matter from flue gases. These are used in many air pollution control systems due to their ability to remove large particulate matters (PMs). And as such, protects finer filtration systems from having to filter larger, more abrasive particles, since finer filters tend to be more sensitive and are generally more expensive.
These devices work much like a centrifuge, but unlike a centrifuge, the flow of dirty air is continuous. The dirty gas is fed into the main chamber, which led the flow to form a vortex due to the geometry of the device. As the flow gets closer to the lower parts, the vorticity increases; however due to inertia, PMs cannot keep up with the vortex within the separator. This led to them being left behind and drop down through the outlet underneath the device. The flue gas then flows upwards, creating a new vortex as it reaches the gas outlet at the top due to buoyant forces.
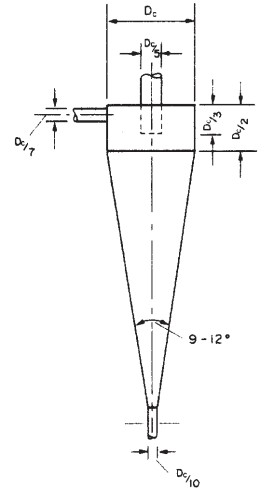
Cyclone dimension approach (Agus Nuryadi)
The first systematic design based on the residence time theory for all groups of cyclones and hydrocyclones were proposed by Massarani (1997). In this principle, if the time it stays inside the cyclone is equal to or longer than the time required to hit the wall, a particle of a given size will be captured. The cut's size corresponds to the particle size that, if entered precisely at the center of the inlet pipe, enters the wall during the residence period (t) (Svarovsky, 1984). Massarani equation-related diameter of cut size (d50); parameter (K) Depending on the shape of the cyclone; the physical properties of the system; and the volumetric feed flow rate (Q), as revealed in the equation below.
Where g(cv) introduces the effect of concentration on the cut size diameter, g (cv) is approximately equal to one for studies with a heavily diluted suspension. Furthermore, The nomographs by Zanker can be used to make a preliminary estimate of the size of cyclone needed. The specialist manufacturers of hydrocyclone equipment should be consulted to determine the best arrangements and design for a particular application. Zanker’s method is outlined below and illustrated in the Example below and based on an empirical equation by Bradley (1960):
Where, d50 is the particle diameter for which the cyclone is 50 per cent efficient, Dc is diameter of the cyclone chamber, u is liquid viscosity, L is feed flow rate, pl = density of the liquid, and ps = density of the solid. The Euler number is the other significant parameter in the cyclone analysis (Eu). The pressure drop in the cyclone ( ∆ P) with the kinetic energy per unit volume of feeding refers to this dimensionless amount. Also, The greater the number of Euler values, the greater the equipment's cost of energy. By equation, the Euler number is defined.
where uc is the average velocity of the fluid in the cylindrical section of the cyclone. Parameter K and the Euler number (Eu) for the Lapple cyclone, as well as the range of gas velocity in the feed section (u), according to Massarani. The ratio between the mass of particles accumulated in the underflow and the mass of particles fed into the cyclone determined the overall efficiency of the separation (η).
Individual separation efficiency (η) is a parameter related to the equipment's separation efficiency for just one particle size. This variable is determined based on knowledge of the overall separation efficiency (η (head)) and the particles' grade distribution in the underflow and feeding, as shown in the following equation. An individual efficiency of separation of 50%, the cut size diameter.
Multiphase particle in cell (MPPIC) (Agus Nuryadi)
The multiphase particle-in-cell (MP-PIC) numerical method for predicting dense gas-solids flow. The MP-PIC method is a hybrid method such as IBM method, where the gas-phase is treated as a continuum in the Eulerian reference frame and the solids are modeled in the Lagrangian reference frame by tracking computational particles. The MP-PIC is a derivative of the Particle-in-Cell (PIC) method for multiphase flows and the method employs a fixed Eulerian grid and Lagrangian parcels are used to transport mass, momentum, and energy through this grid in a way that preserves the identities of the different materials associated with the particles. The main distinction with traditional Eulerian-Lagrangian methods is that the interactions between the particles are calculated on the Eulerian grid. The Eulerian-Lagrangian method and the multiphase particle in cell (MPPIC) method have been used in this study. The model of the MPPIC is a Model Collision in CFDSOF, first of all, PIC models are derived from a Liouville equation describing the time evolution of a particle distribution function.
where X is particle position, ܷUm is particle velocity, p m is particle density, ܸ Vm is particle volume, and t is time. The subscript ݉m is indicative of nodding to solids phase ݉, which in this case would indicate a unique solids class of particles.
Here ∇ um is the divergence operator with respect to the velocity, ܷUm and A m is the discrete particle-phase acceleration. The particle distribution function integrated over velocity and mass will yield the likely number of particles per unit volume at the position, X, at time t, for small intervals of (Vm + dVm, pm + dpm, Um + dUm). The solids volume fraction, Es, can then by represented through the distribution function using a volume integral.
The solids phase is coupled to the Eulerian governing equations through the interphase momentum transfer term. Allowing Igm to be the contribution due to interphase momentum transfer between the gas and the m th solid phase, Where Dm is drag coefficient and ∇ p is pressure gradient.
Conservation Equation (agus nuryadi)
The word particle, a single piece of material, spherical in nature, having physical characteristics that can be uniquely defined (like density, chemical composition, etc.); the word parcel indicates a statistical collection of particles of similar physical characteristics.
Conservation of Mass
The conservation of mass (or continuity equation) for the p th MPPIC parcel is given by managing the particle’s statistical weight, Wp, and considering its mass change, dm/dt, under the effects of a chemical reaction.
where R pn is the rate of production/consumption of the n th chemical species, and Np is the number of chemical species. This is not unlike the conservation of mass equation defined in Musser and Carney (2020). Specifically, the right-hand side of (eq above) accounts for interphase mass transfer because of heterogeneous chemical reactions or physical processes, like evaporation. In non-chemically reactive simulations (or those without phase change), the right side of Equation (eq above) equals zero.
Conservation of Species Mass
The n th species mass conservation equation for the MMPIC parcel is given by:
Where X pn is the n th chemical species mass fraction, and R pn is the rate of formation of species mass attributed to chemical reactions or physical processes. In non-chemically reactive simulations (or those without phase change), the right side of Equation (above) equals zero.
Conservation of Translational Momentum
The general conservation of translation momentum for the p th MMPIC parcel in the i th coordinate direction is given by:
where ܷU i is the parcel velocity, and ݃g i is the gravity body force. The first term on the right-hand side is the gravitational body force. The second term is a PIC-specific term derived from interparticle stress, described in detail in the section Interparticle Stress below.
As expected, the position of a parcel is related to its velocity through:
where Xi is the parcel position in the ݅i th coordinate direction.
Interparticle Stress
The interparticle stress variable follows the form suggested by Snider (2001). Specifically,
where E cp indicates a pre-determined, problem-specific, close-pack volume fraction for the solids phase. P s is an empirical pressure constant relatable to the scale and unit of the problem under evaluation, and B is an empirical unitless exponent, usually between 2 and 5. alpha is a tiny constant (e.g. 1e-7) to assure a non-zero denominator in calculations.
Conservation of Internal Energy
The general conservation of internal energy for the p th MMPIC parcel follows the same theoretical underpinnings as DEM. The internal energy is presented in terms of temperature. For an isothermal parcel (a PIC assumption),
where C p and ܶT are parcel specific heat and temperature (same as particle values). The first term on the right-hand side represents changes in internal energy accompanying species formation or destruction from a chemical reaction and/or phase change (h pn is the n the species-specific enthalpy) The last term, S p is a general source term. Note that S p might represent particle-particle heat transfer (currently 0 in PIC; there is no conduction model), fluid-particle heat transfer (convection), or radiative heat transfer (currently 0 in PIC; radiation model is pending).
Objektif
1. Performing CFD analysis on Cyclone Separator using various parameters obtained from literatures
2. Analyzing the result obtained from the CFD analysis, such as bulk diameter of the discrete phase, velocity fields, and pressure gradients.
3. Understanding the impacts of various boundary conditions on various aspects of the simulations, such as convergencies, how boundary conditions impact results, and how the flow itself behaves during simulation.
4. Applying knowledge regarding CFD analysis, such as how to choose timesteps for transient flows, making sure that the meshes are applied correctly, and applying boundary and flow conditions.
5. Verifying the results through the means of grid independence study, which ensures the calculations are correct regardless of the meshing, and the difference between results are within the margin of error.
6. Validating the results by comparing the results with literatures and real applications.
Metodologi
LES (Large Eddy Simulation)(Josiah)
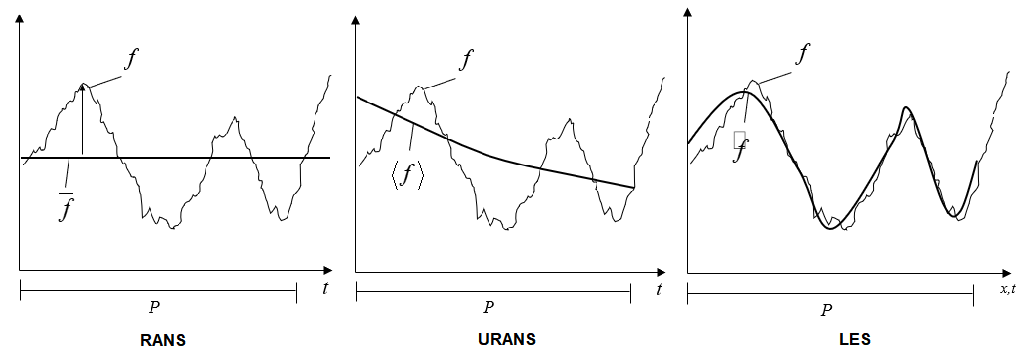
In this simulation of cyclone separator, we are using the unsteady equations in the 3D mesh which have different Navier-stokes equations in each local condition. These equations need to be solved on large scale to a small scale to resolve the eddies in the turbulent flow. As there are mainly 4 methods, which are DNS, RANS, URANS, and LES, to solve the simulation of turbulence, LES examined to be the only convergent and viable choice to represent the cyclonic motion of the fluid. Theoretically, this is possible since Large Eddy Simulation (LES) is based on the idea of performing a local scales separation (in general in space and time) of the characteristic scales of the motion. This method often introduced as local filtering.
The lower method, such as RANS and URANS, based on statistical averaging, leading to steady equations (eventually also in 2d) and diverging when calculating this particular condition. While the better method, DNS, is not available in common CFD applications since it is computationally onerous as well as not fully feasible for engineering applications (computing hours result in more cost).
Model Komputasi dan Simulasi
Simulation Boundary Condition (EDO)
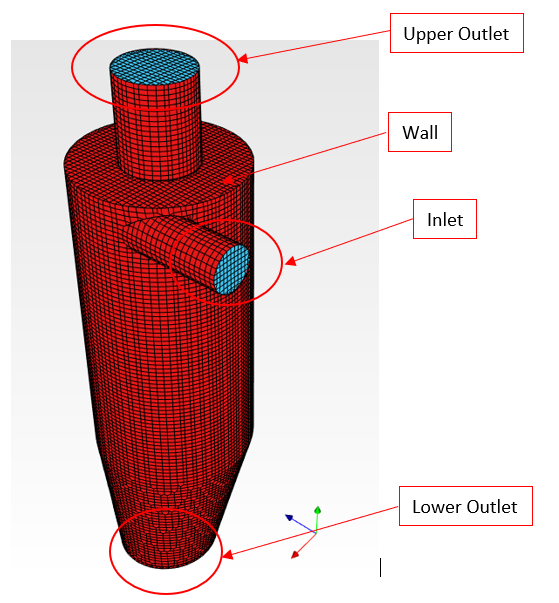
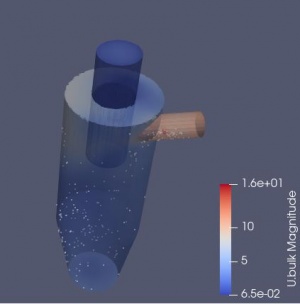
One of the most important aspect in preparing the simulation model is boundary condition. The boundary condition should be determined properly in the pre-processing stage of the simulation. The boundary condition should be set up as it can represent the actual condition of the case. In this case, the flow consist of flue gas and catalyst particle. Thus, The flow would be modeled as multiphase flow and multiphase Eularian-Lagrangian model would be used for this simulation. Therefore, they would be an additional boundary condition for the particle phase. The simulation would also be considered as turbulent flow. Large Eddy Simulation (LES) model would be used in this simulation. The domain simulation consist of 3 boundary area: Wall, inlet, upper outlet, lower outlet. The lower outlet as shown in Fig. below.
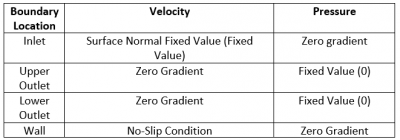
The inlet boundary is set as velocity inlet, so that the inlet velocity of the flue gas,which is the primary fluid, is set up. The pressure at the inlet section will be calculated according to the inlet velocity and the outlet pressure. Both upper and lower boundary condition is set as outflow with the total zero of the total pressure. The zero total pressure does not actually represent the vacuum condition, but it is set such that would give a better way of getting how much the pressure difference or pressure drop occurs. In other word, instead of set up the specific value of the pressure at the outlet boundary condition, the solver would calculate how much the pressure drop occurs with the given velocity inlet. The wall boundary condition is set as no-slip condition. Hence, the velocity at the wall would be zero. The list of the boundary condition in this simulation is given in the Table below:
The zero gradient value means that the value at the boundary location of both velocity and pressure is equal to the value from the neighbour cell, which means that the value is following the calculation result.
Boundary Condition for the discrete phase
The Discrete phase boundary conditions is set up for particle boundary condition. The particle properties, such us particle diameter, bulk density, and particle void fraction is required. For example, consider that the cyclones is used to separate between flue gas and Zeolite-Catalyst. Hence, the the properties of the zeolite catalyst should be set as the given particle properties in the boundary. The way of how particle is injected into the fluid domain needs also be considered. In this case, we consider that the particle is injected at the inlet boundary along with the flue gas. Therefore, the inlet particle velocity should also be set up. In case where the particle is actually dispersed in the fluid, the particle injection speed should be set in a low value. Furthermore, the total particle mass, the duration of particle injections, and the number of parcel per second should also be determined properly.
Hasil dan Pembahasan
Validasi Tekanan (Bintang)
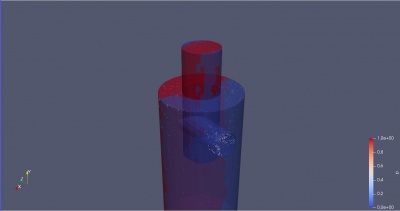
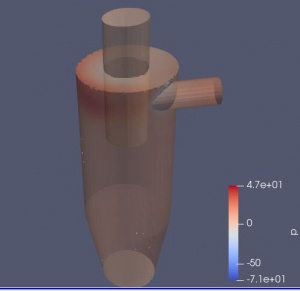
Based on ideal condition, pressure distribution should vary linearly by altitude, in which in this case variation by altitude is not significant due to only small change of altitude is present inside this small cyclone. The change on static pressure is more affected by the change in flow velocity. However, the reduction of static pressure is also quite small to give variation on the static pressure itself. Significant pressure gradient can only be observed near the outlet of the inflow, where the inlet flow hit the cyclone wall for the first time. At this location, the flow decelerates to zero, hence producing stagnation pressure, before being redirected due to the change in momentum caused by the cyclone wall itself and producing a vortex flow. In correct CFD simulation, this should always be the case with exception if the fluid velocity going near the speed of sound in which compressibility effect cannot be neglected which is not the case on this simulation. However, one of our simulation shows a different pressure distribution which was not in accordance to the ideal condition as shown in figure (number).
The pressure distribution in this case was really high on one side and really low on the other side, and both having insignificant pressure change vertically. This abrupt change in pressure on each side of the cyclone is not in accordance to the ideal condition, as it should be as explained previously. One parameters that shows the error of this simulation is the value of the pressure that reaches 1e36 Pascal. After a long discussion, we found that the reason why this simulation isn't correct is because the convergence, observed by the graph of residual over time, is really high. Convergence of calculation should be at least 1e-4 to be said 'loosely converge'. However, the residuals in this simulation is almost 1, meaning the simulation does not converge at all. Based on our discussion, several factors might cause this result, for instance, the parameters of boundary condition. We try to change the parameters inputted to the boundary condition, in this case the inlet velocity, and letting the rest of the parameters stay the same. We found that the solution does converge after we change the inlet velocity parameters. Setting the correct boundary condition can give a huge effect on the convergence of the CFD simulation and thus should be studied more in depth.
Variasi Kecepatan Inlet (Ales)
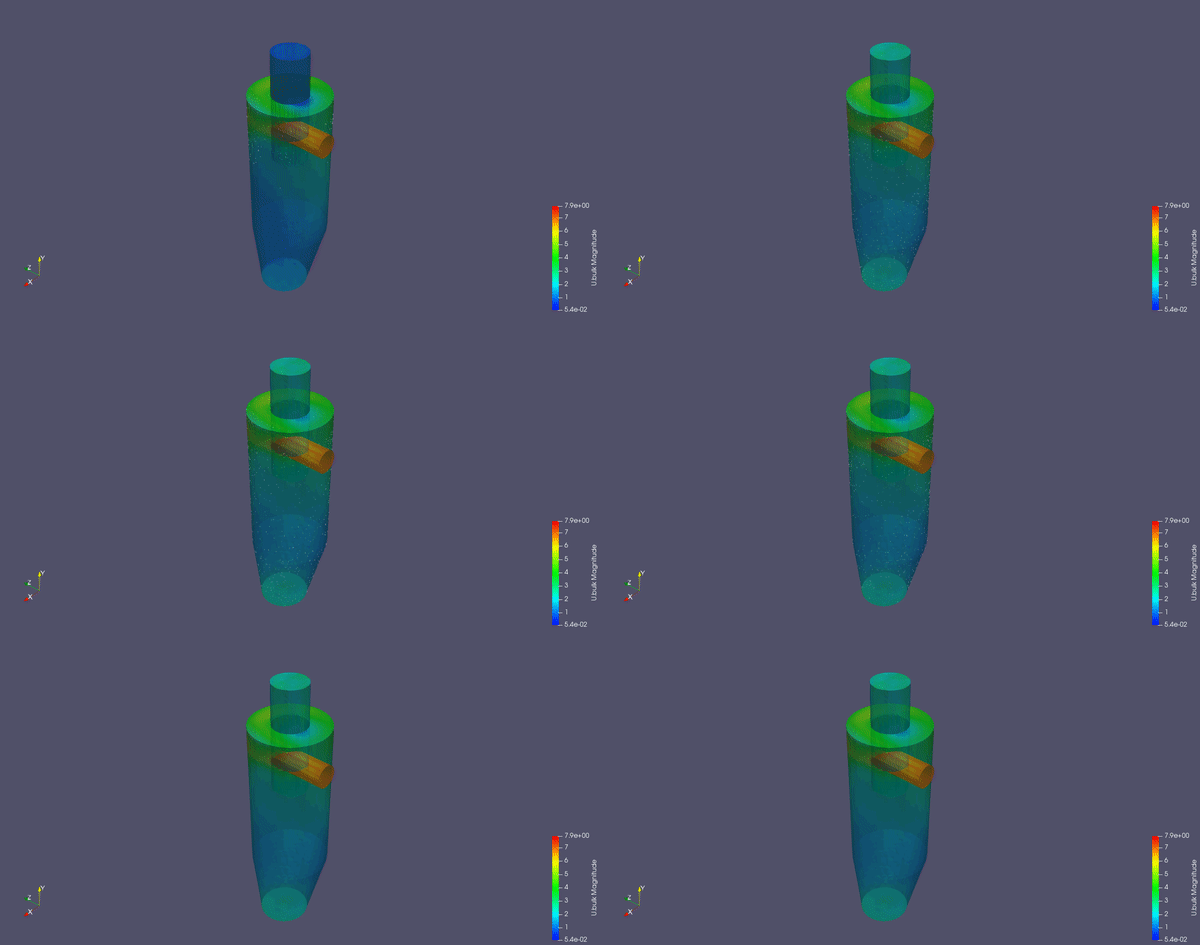
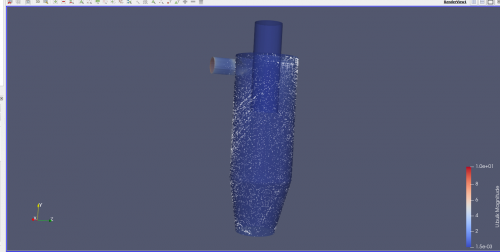
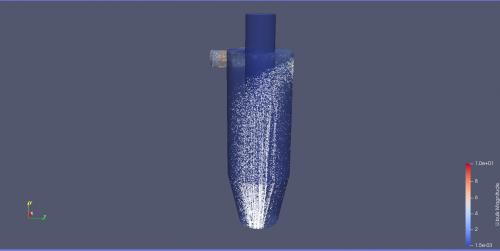
This section discusses velocity variation within the cyclone's inlet. The simulations were varied with three types of velocities: 7 m/s, 12 m/s, and 21 m/s. Each of them delivers 6 kg of particles in 2 seconds of entering the cyclone's inlet, delivering 2000 parcels per second. In this simulation, it was assumed to uniform, and the diameters of particles have differed from 100 μm until 350 μm. Assuming that the simulation used Large Eddy Scale (LES) Turbulent simulations, it has resulted in significant differences, especially in its velocity outlet between the solid and the gas phase. Based on the results, every simulation resulted in the same particle direction, which rounded in the cyclone's wall and then helically accelerated into the flow outlet. Although the results were limited on both of the directions of the distinct phase, they were visualized using the color grading of the post-processor.
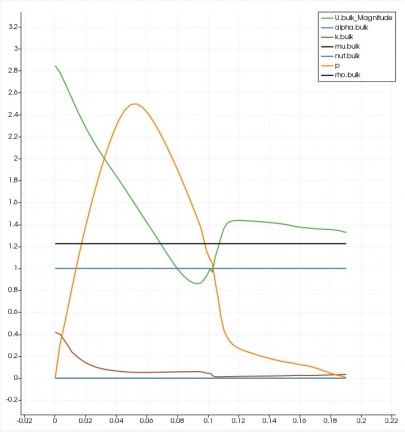
The velocity outlet of the system depicted on the graph below, which indicated (with the green line) that the particles' outlet velocity increased within the increment amount of the inlet velocity, whereas the gas outlet velocity reduced within the height elevation of the system. The reduction of every velocity magnitude in different simulations occurred due to the unbalanced force between the particle and the gas movement. The particles gain their velocity due to the gravitational force within the additional inlet velocity that affects velocity magnitude. This is also affected by the cyclone's geometry that creates a helical acceleration for the particles before exiting the system. But, the gas velocity acted in a contrary way with a reduction of the outlet velocity. The gas velocity occurs as a result of the buoyancy force acted within the cyclone. Yet, it is still suppressed by the gravitational force that reduces the gas velocity exiting the system. In spite of that, the inlet velocity increment still affects the outlet velocity of the system with the condition that the increment would be insignificant.
Parcel Fluida (Elvin)
Fluid parcel is described as a very small finite amount of fluid which contains the number of discrete particles in the system. When simulating multiphase flows such as this, the fluid parcel contains a number of properties belonging to the discrete particles such as mass, velocity, temperature, momentum, and etc. These parcels are tracked as it flows through the system fluid from the inlet to the outlet or till it settles which in turn lets the solver calculate any changes in its properties from contact or interaction with other parcels.
When modelling the particle injection and distribution, the number of injected parcels per second as well as parcel size distribution affects the accuracy of the model. This is because each parcel contains a number of discrete particles set from the total mass and density. With higher number of injected parcels per second, it gives a more accurate representation of the model in reality for enabling more parcels to be tracked just like how higher number of mesh gives better accuracy (Vogiatzaki et al., 2017).
Distribusi vektor kecepatan dan tekanan di sepanjang cyclone (Fuad)
Bagian ini merupakan pembahasan mengenai distribusi vektor kecepatan dan tekanan di sepanjang cyclone. Boundary condition yang digunakan sama dengan yang terdapat pada tabel boundary list, dengan kecepatan inlet sebesar 12 m/s. Boundary condition untuk discrete phase sama dengan yang digunakan pada bagian variasi kecepatan inlet, namun terdapat perbedaan pada diameter partikel yang digunakan yaitu 10 μm hingga 3 mm.
Hasil distribusi kecepatan dan tekanan yang diperoleh pada simulasi seperti terlihat pada gambar berikut.
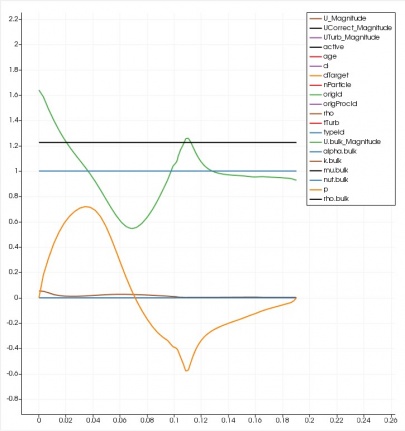
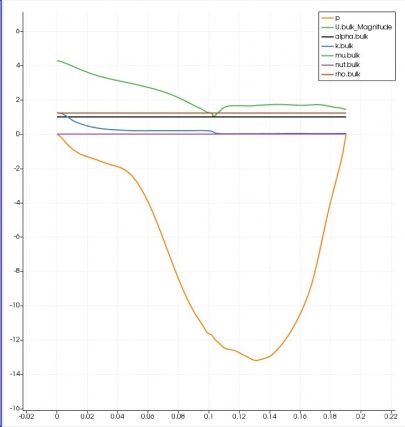
Nilai dari distribusi kecepatan dan tekanan pada sumbu x dapat terlihat pada grafik berikut
Nilai dari distribusi kecepatan dan tekanan pada sumbu y dapat terlihat pada grafik berikut
Nilai dari distribusi kecepatan dan tekanan pada sumbu z dapat terlihat pada grafik berikut
LES Convergent while RANS Divergent(Josiah)
Kesimpulan
Referensi
Vogiatzaki, K., Crua, C., Morgan, R., & Heikal, M. (2017, July). A study of the controlling parameters of fuel air mixture formation for ECN Spray A. In Ilass Europe. 28th european conference on Liquid Atomization and Spray Systems (pp. 2-9). Editorial Universitat Politècnica de València.


