Two-dimensional numerical simulation
The simulation will be validated with the previous three-dimensional method by Bayraktar, et al. (2017), compared to its efficiency and diverter distance from the inlet's system. A simulation, regardless of two-phases and boundary conditions, needs to be solved beforehand to achieve the mathematical solution. The geometry uses the one that has been investigated by Efendioglu et al. (2014). It is scaled down into 1:100 with 100 divisions in each axis (X and Y). Knowing the conditions in every control volume within a certain time is simulated in a transient state simulation. The fluid inside is assumed as incompressible air within subsonic speed around 5 m/s. Because it will cause a turbulent flow on a large scale, the Large Eddy Simulation (LES) method is implemented during the simulation. The height difference between the two outlets and the scaled-down geometry affected the outlets' dimensions' exact number. The pressure assumed is based on basic hydrodynamic pressure theoretical expression. The results were 0 Pa and 15.79 Pa, upper-pressure, and lower-pressure outlets, respectively. Based on the figure below shows the animation from the result of the simulation.
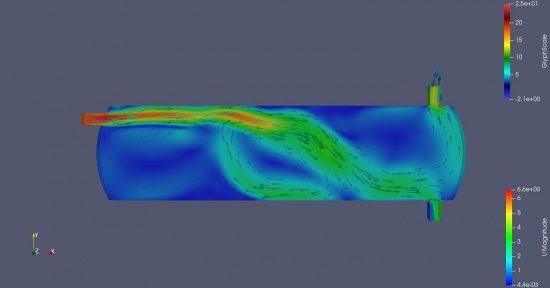
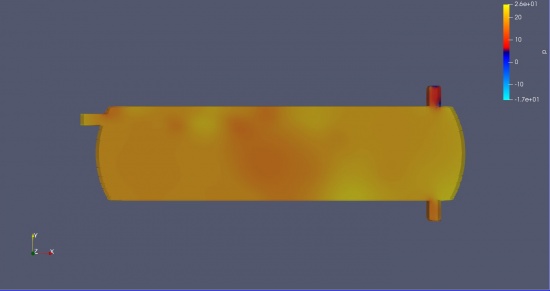
Based on these figures, they have shown that the simulation satisfies the theoretical expressions, although the flow inlet affects the magnitudes between them. The glyph feature from the Paraview post-processor shows the velocity vector that flows to both outlets. In contrast, the pressure magnitude shows that the bottom outlet receives a larger magnitude of the pressure. Because of the low kinematic viscosity and density, the flow reaches the turbulent region, which the LES method is suitable in calculating the eddies that occur. Provided that the grid-independent study has been investigated, the results will likely to gain more accurate results. To sum up, the single-phase simulation has fulfilled the theoretical expression, and using two-phase simulation is now suitable for the next step.
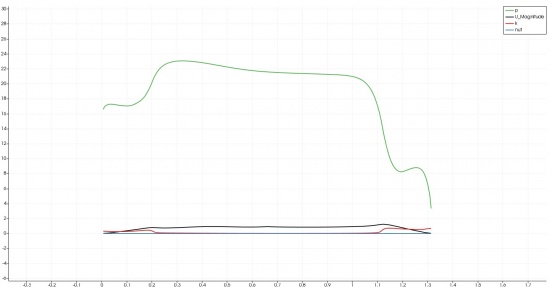
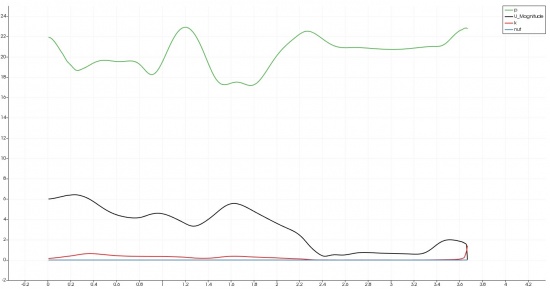
The velocity inlet, which was previously assumed to be 6 m/s, resulted in a fluctuating magnitude as the system's air travels. Based on the black line from the graph, the air fluctuates due to the gravity effect that occurs in the system. Figure 5 shows that as the air flows departed from the system, the velocity by far shows slightly constant results. Figure 3 also shows that the air affected by the gravitational force was also affected by the buoyancy force that occurred in the system. It is shown by the vectorial arrows that represent the air direction splits as the effect of two different forces. According to the graph, it sums up that the air travels sensibly, although the accuracy might not be the greatest due to the low numbers of mesh.


