Tugas Besar CFD - Josiah Enrico S
Contents
Title: CFD Investigation of Dust Particle Elutriation in Plastic Pellet Industry
Abstract
As elutriator, or an apparatus used to separate suspended solid particles according to size, have been used in the plastic industry regarding dust particles such as streamer or angel hair elimination, there is a need to observe the effectiveness of this control process to produce cleaner plastic pellet. In doing so theoretically, some recent studies show differences in particle size are exploited when they are subjected to an upward flowing current of fluid, leading to separation into size-based underflow and overflow streams. The tendency of a particle to report to either stream is dependent on its terminal sedimentation velocity, as well as the upward velocity of the fluid. Where the terminal velocity exceeds the fluid velocity, the particle will settle against the current and report to the underflow and vice versa. This research will recreate the flow using computational fluid dynamics application to help us understand the variation of particle size or density of particles leading to different sedimentation velocities in the separation process.
Introduction
Plastic pellets, also introduced as nurdles, are the building blocks for almost every product made of plastic. About the size of a lentil, plastic pellets are produced by petrochemical chemical companies and transported to plastic manufacturing facilities where they are melted down and shaped into a final product. In 2015, it is estimated that 270 million metric tons of plastic are produced around the globe every year, much of which begins its life as a plastic pellet.
One typical problem along this industry is that producing plastic pellet always comes with some contaminants or dust which need to be removed. Those matters occur naturally in products like minerals, food, tablets, and other bulk solids, while others are caused by the way the products are handled. Impurities in plastic pellets, both fines (dust) and angel hair (streamers), are generated by the friction in conveying lines. Dilute phase systems create large amounts of dust and streamers; the higher the velocity, the larger the amounts of impurities. (figure 2)
For instance, as depicted in figure 1, these bends cause pellets to hit the inner wall of the elbow. Depending on the resin properties, elbow design, and air velocities, some resins get deflected to other areas of the elbow and some get deflected back to the air stream. Most slide against the elbow wall. This sliding generates frictional heat. pellets with low melting points, soften and smear along the wall. This smearing happens fast, and once started, it often grows as incoming pellets rub against the existing smear. Incoming conveyed pellets randomly break off the smeared plastic into long, ribbon-like strands, almost like loose bird’s nests which are called angel hair.
Cleaning bulk solids in the plastics industry is important to improve the quality of both the pellets and the finished plastic product. Dust and angel hair can contaminate resins at the receiver, including changing the resin’s properties and color. This problem also leads to lower quality end products such as weak spots in fibers, blurry surfaces resulting from vaporized dust particles, flaws in wire insulation, etc. the mixture of these impurities with unaffected resin often plugging a feed area and eventually starving a receiver. These clogged vent or duct resulting in shorter machine and equipment lifespan wherein increasing factory cost.
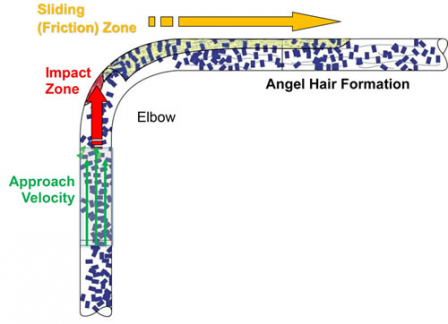
Figure 1 Bend pipe effect
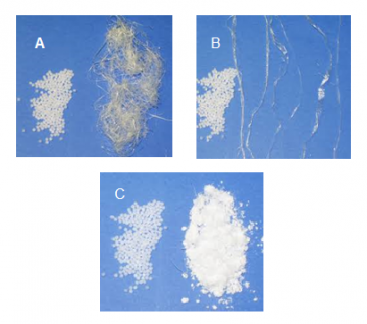
Figure 2 A) streamer, B) angel hair, C) Fine (Dust)
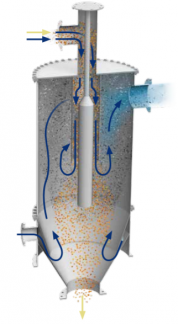
Figure 3 Elutriator Model
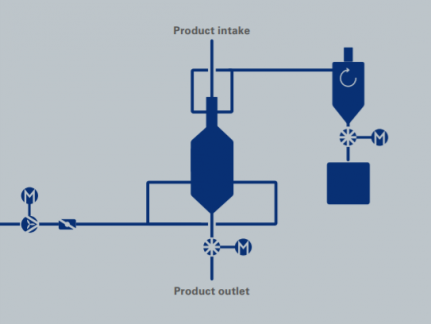
Figure 4 Elutriator Working System


Therefore, separators based on a variation of density, size, and geometry are necessary to overcome the problem. Typical separator like screening isn’t appropriate for fines removal because the thread-like angel hair gets stuck in the mesh openings and gradually blinds the screen. While it is true that using airflow is very effective, the cyclonic separator is also unfavored since the movement along the cylindrical chamber would generate additional dust due to surface friction. This is why elutriator stands compared to the other method.
In a simple elutriator, as shown in figure 4, the multiphase fluid flow will enter vertically into the elutriation chamber through the inlet located at the top of the elutriator. This flow will then be channeled to a diffuser at the center of the cylinder so that the fluid flow will form an annulus dome between the diffuser and the apparatus wall and the plastic pellet is evenly distributed. This distribution allows all pellets to be exposed to the wash air that blows upward and the elutriation will run optimally. In the elutriation zone, dust and contaminants that are relatively light will rise upwards and form an overflow. This overflow is discharged from the elutriator to a dust collector. Simultaneously, the plastic pellets will slowly fall down and form an underflow to the elutriator’s outlet, where a rotary airlock valve continuously discharges the pellets to the downstream process. In a pressure conveying system, the valve’s airlock function minimizes the leaking flow of wash air from the elutriator outlet, and in a vacuum conveying system, it minimizes airflow entering the elutriator.
In this present CFD study, the gas-solid flow will be simulated using the MP-PIC method in a common elutriator model. The geometry is inspired by Elutriator GSE (figure 3) produced by Zeppelin Systems GmBH® and modified or modeled using Autodesk Inventor 2019. This CFD itself is simulated with CFDSOF-NG® software, a CFD software developed by CCIT Group Indonesia with the capability of simulating a wide range of fluid flow and heat transfer phenomena on complex geometry. The final result showing the pressure distribution and the development of wash air velocity due to variance of pellet size will be compared to the analytical solution to verify the simulation
Elutriation Principle
The interaction of particles moving through a fluid or in reverse is the basis of elutriation. Elutriation (the converse of sedimentation) is where a fluid (usually a gas) is forced through a powder bed, and can thus be used to determine particle size distributions. The elutriator utilizes a rising current of fluid to sweep the system free of particles smaller than a specific size. When the velocity of a rising current in a fluid system equals the terminal settling velocity of certain particle size, the particles remain stationary in the rising fluid. Larger particles have a greater terminal velocity and will settle toward the bottom. The size of a particle that remains suspended in a rising current of a given velocity will herein be referred to as the critical size. The settling velocity of particles in a rising current of fluid is governed by Stokes's Law. Therefore, A. Doroszkowski formulated the wash air velocity as follows:


Terminal-velocity constants for common shaped particles are

The particles can be fractionated according to size by varying the quantity of air passing through the air jets or by altering the size of the elutriation chamber. One can thus obtain a cumulative size distribution by collecting the various fractions in settling containers. Since different elutriators are difficult to govern generally, each plant must be analyzed particularly.
Objectives
Using computational fluid dynamics (CFD) application, the objectives of this study are as follows:
- Performing CFD simulation of elutriation in selected geometry using various parameters from literature
- Investigating the relation between the inlet velocity of wash fluid and the pellet density or diameter in elutriation chamber.
- Verifying the results through residual (or relative change) convergence test
- Validating the results to existing studies or literature.
Methodology
MP-PIC (Multi-phase Particle-in-cell)
Multiphase particle-in-cell (MP-PIC) is a mathematical model of separated particulate multiphase flow using a continuum for the fluid and a Lagrangian model for particles. This method allows an economical solution for flows with a wide range of particle types, sizes, shapes, and velocities. The MP-PIC method is described by the governing equations, interpolation operators, and the particle stress model.
- Fluid phase (continuum)
- The continuity equation for the fluid with no interphase mass transfer is

- where u f is the fluid velocity and θ f is the fluid volume fraction. The momentum equation for the fluid is

- where ρ f is the fluid density, p is fluid pressure, and g is the gravitational acceleration. F is the rate of momentum exchange per volume between the fluid and particle phases. The fluid phase is incompressible and fluid and particle phases are isothermal. The momentum equation presented here neglects viscous molecular diffusion in the fluid but retains the viscous drag between particles and fluid through the interphase drag force, F.
- Particle phase (lagragian)
- The dynamics of the particle phase is described using the particle probability distribution function φ (x, up, ρp, Ωp, t), where x is the particle position, up is the particle velocity, ρp is the particle density, and Äp is the particle volume. For the present, it is assumed that the mass of each particle is constant in time (no mass transfer between particles or to the fluid), but particles may have a range of sizes and densities. The particle φ change over time is obtained by solving a Liouville equation for the particle distribution function,

- where ∇u is the divergence operator concerning velocity. where A is the particle acceleration discrete particle acceleration equals to

- The terms represent acceleration due to aerodynamic drag, pressure gradient, gravity, and gradient in the interparticle stress, τ.
- A numerical solution of the particle phase is obtained by dividing the distribution into a finite number of "computational particles" that each represents a number of real particles with identical mass density, volume, velocity, and location. At each time step, the velocity and location of each computational particle are updated using a discretized form of the above equations. The use of computational particles allows for a significant reduction in computational requirements with a negligible impact on accuracy under many conditions. The use of the computational particle in the Multiphase Particle-in-Cell method allows a full particle size distribution (PSD) to be modeled within the system as well as the modeling of polydisperse solids.
- Interpolation operators
- Particle properties are interpolated to and from the Eulerian grid in the MP-PIC scheme. Interpolation operator properties are defined which are both locally and globally conservative in mapping to and from the grid. Snider (2001) uses a staggered grid where momentum properties are calculated at cell faces and scalar properties are calculated at cell centers. Both scalar and momentum particle properties are needed. The continuity equation and pressure equation are calculated at cell centers. The momentum transfer between particles and gas is calculated at cell surfaces. This requires four sets of interpolation operators in three dimensions. Scalar properties, at cell centers, are mapped with one set of interpolation functions. Momentum properties, at face centers, are mapped with three other sets. The operators have the same definition but have different support in the axis of interpolation. Those transfer of particle properties is performed using linear interpolation functions.
- Particle stress model
- The particle normal stress is modeled by a continuum calculation of the particle pressure and the subsequent normal stress force is applied to discrete particles. The Lagrangian discrete particle stress model which uses the stress gradient eliminates the need for an implicit solution for the particle normal stress (particle volume fraction). The model is robust and fast which makes it well suited for three-dimensional calculation. Collisions between particles, where particles are modeled as a continuum, are estimated by isotropic interparticle stress where the off-diagonal elements of the stress tensor are neglected. Snider (2001) has suggested calculating the particle stress as τ;

- here θc is the close-pack volume fraction and β, Ps and ε are constants.
Simulation Properties
The gas-solid flow inside the elutriator is simulated in the transient incompressible fluid and the turbulence is calculated with the LES (Large Eddy Simulation) method. The particle is injected for 2 s and released in 5000 parcels per second. The physical properties for both gas and solid particles were then defined as shown in the table below and followed by imposing boundary conditions. Note that the particles in this simulation will be injected uniformly in the diameter range from 0,3 to 3 mm to validate the results with the analysis at the end. Moreover, the PIMPLE algorithm (a combination of PISO and SIMPLE) was used to solve the pressure-velocity coupling problem along the MP-PIC method to solve the particle modeling. The simulations were run throughout 5 s with a time-step of 0.025 s and write interval if 4 iterations.

The additional simulation was also conducted to illustrate the effect of particle and density variation on solid flow under the elutriation chamber. The property difference was defined as shown in the table below. These simulation performed in the same pre-processing as the main one
| Particle Diameter | Density | |
|---|---|---|
| Test 1 | 0.5 mm | 1200 kg/m3 |
| Test 2 | 0,85 mm | 1330 kg/m3 |
| Test 3 | 1 mm | 1550 kg/m3 |
Geometry Model and Meshing
As mention earlier, the geometry is created using Autodesk® Inventor 2019 and derived from the simplification of the Elutriator GSE model produced by Zeppelin Systems GmBH® with the design parameter shown in the figure below. This meshing is generated using the built-in mesh generator in CFDSOF-NG® with the resulting mesh illustrated in the following figure. To ensure that the generated mesh is sufficient to provide an accurate solution, a mesh independency study was performed by varying numbers of cells of 2419, 7616, 24861, 84251, and 277504. But the main simulation will be conducted in meshing with 277504 to optimize the result.
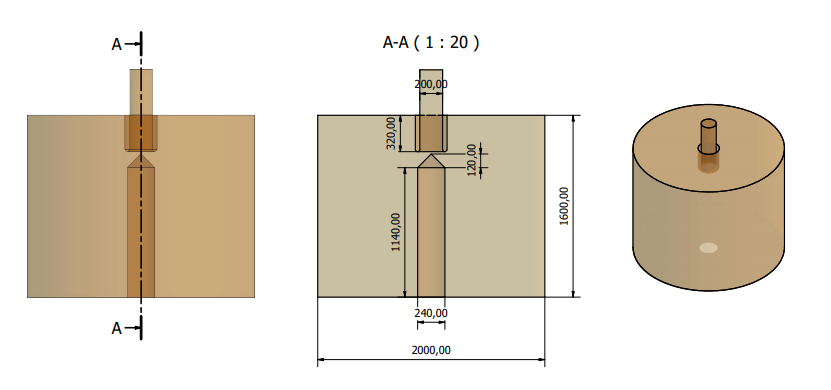
Figure 5 Drawing of Customized Geometry
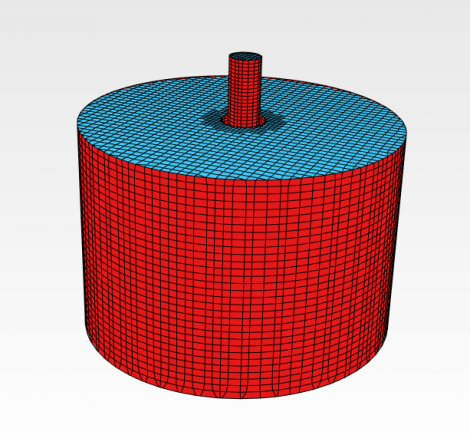
Figure 6 Geometry Meshing


Boundary Condition
The computational domain consists of three main boundaries which are the gas-solid inlet, wash air inlet, and the overflow outlet as seen in figure X. The multiphase inlet was defined as a zero velocity inlet. The wash air inlet in the bottom part was also defined as velocity inlet but with 4,2 m/s of flowing air. This is actually the simplification of the model since, in the factual apparatus, this patch function as both wash air inlet and clean pellet outlet (equipped with air valve lock to maintain the pressure) Other than that, the overflow or the contaminant outlet considered to in an atmospheric condition which pressure was defined as zero-gauge pressure and the wall was defined by rebound boundary condition with zero restitution coefficient.
Result and Analysis
Mesh Independency Study (Verification)
Mesh independency study is one criterion to assure the independence of solution from numerical error due to mesh resolution. Not checking this is a common cause of erroneous results in CFD, and this process should at least be carried out once for each type of problem that is analyzed. To perform the test, the value variable interest is monitored first in a small number of cells. Then, we can increase the number of mesh and recheck the interest value. This work must be undertaken until the interest value does not change with respect to the number of cells. In this observation, the value of variable interest is considered to be the pressure drop along the horizontal plane surrounding the diffuser. The result is given in the following figure
| Number of Cells | Pressure Drop (Pa) |
|---|---|
| 2419 | 47,0227 |
| 7616 | 49,2262 |
| 24861 | 50,0669 |
| 84251 | 50,5412 |
| 277504 | 50,7591 |
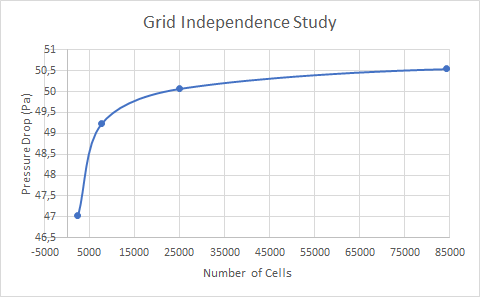
Figure 7 Mesh Independence Test Graph

As shown above, the difference is relatively significant between the mesh of 2419 cells and 7616 cells. however, the increase from 7616 cells to 277504 cells would give a more stable velocity. Therefore, this study is conducted using the mesh of 277504 cells.
Result Variation

|

|

|
| rho=1200 kg/m^3 | rho=1330 kg/m^3 | rho=1550 kg/m^3 |

|
|

|
| d= 0,5 mm | d= 0,85 mm | d= 1 mm |
Based on the simulation results carried out as shown in the figure above. Particles with a relatively small diameter will experience an upward flow while particles and a large diameter will fall towards the collector at the bottom. In this test, where the wash air velocity is 4.2 m/s and the density value is 1330 kg/m3 (polyethylene pellet), the cut-off diameter will be 0.9 mm. Unfortunately, the test on the cut-off diameter is classified as difficult to simulate and tends to diverge in modeling using CFDSof so that in this simulation, the transitional diameter selected is 0.85 mm. On the other hand, when the density is varied, the same pattern is obtained with the variation in diameter. The relatively high density will make the particles classified as heavy and will drop to the downstream, while light particles because they have low density will be blown into the upstream. In this second variation, the cut-off density value obtained is 1350 kg/m3 when tested with a particle diameter of 0.85 mm, and a wash air velocity of 4.2 m/s. For the same reasons as the previous variation, the intermediate-level model shown is 1330 kg/m3.
This additional simulation is accomplished to prove the effect of differences in density and diameter on the terminal velocity of the particles which will experience elutriation. When compared with the equation given by Dorozkowsky (1999) at the preview, the terminal velocity is directly proportional to the square value of the particle diameter for the laminar flow. Therefore, the increase in the velocity value will follow the rise of the diameter number. This clearly related to the increase of wash air velocity generated by elutriator. If the diameter increases but the wash water velocity is constant, the particles will sink and vice versa if the diameter decreases. The change in bulk or particle density relative to the washing fluid density also shows the same straight correlation. Increasing density triggers increasing terminal velocity value. Likewise as before, if the wash velocity of fluid cannot increase to the same rate, the particles will sink. Unfortunately, there is no general formula for all elutriators because the constant value of streamline and turbulence flow on each elutriation system are dissimilar and are influenced by various factors such as geometry, temperature, etc. But regardless of the condition, the results of the CFD simulation that has been conducted satisfy the formula analysis of the previous study.
Figure 8 Simulation Result
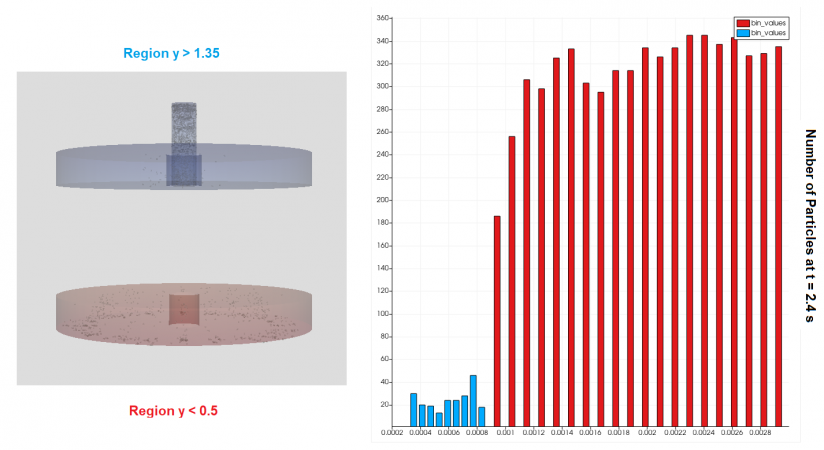
Figure 9 Particles distribution after elutriation


After performing simulation variations for certain solid properties, the main simulation is carried out following real conditions that may occur in the industry. In the CFD simulation results in the figure above, contaminants that are light, smaller in size than pellets, and have irregular geometries are described as blue-colored particles with a diameter smaller than 0.85 mm. Red-colored particles with a diameter between 0.85 mm to 3 mm will describe PET pellets. From these results, wash air that is streamed from the bottom inlet will filter the mixed flow of these particles and form a separation area around the annulus in the elutriator. The separation that occurs in this process is influenced by differences in particle size and particle geometry.
From these results, we can also analyze the distribution of the elutriation results in different regions. As shown in the figure below, the main geometry can be split or clipped in Paraview into two parts, namely the upper region (> 1.35 meters) and the lower region (0.25-0.5 meters). Then by using the histogram feature, a bar graph of the distribution of particles of a certain diameter can be generated in each region being tested. From this graph, it can be concluded that the CFD simulation of the elutriation process got satisfactory results because in the lower region all small particles, meaning contaminants, were successfully eliminated (red color) and in the upper region around the outlet no pellets were wasted with dust (blue color).
Distribution of U Bulk
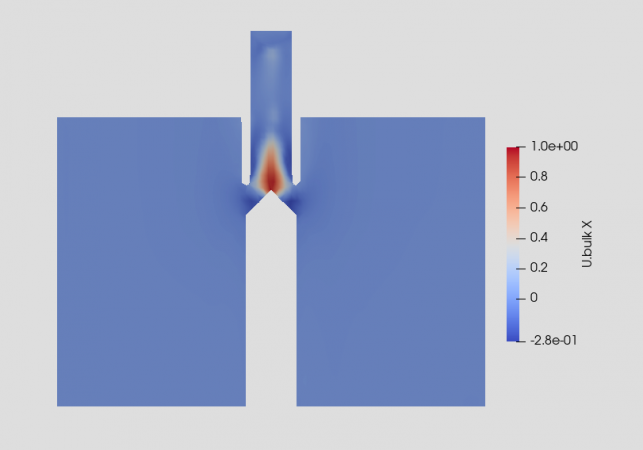
Figure 10 Distribution of horizontal U Bulk
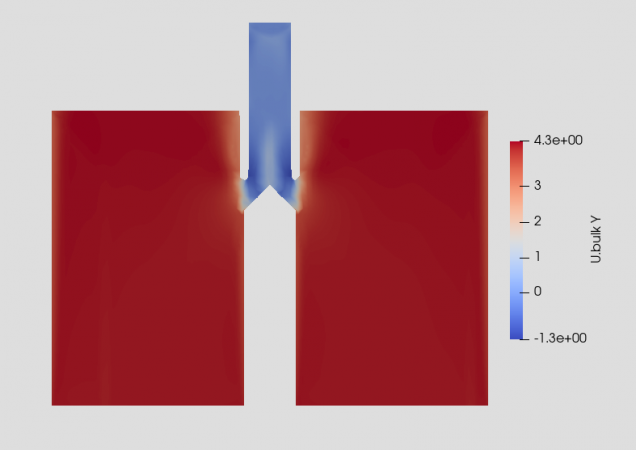
Figure 11 Distribution of vertical U Bulk


This section will analyze the distribution of U bulk or wash air velocity in the elutriation chamber. In the figure above, it is noticeable that the U Bulk distribution in the horizontal direction (X and Z direction) will be mostly colored blue and have relatively small values because there is no source of horizontal fluid flow. But at the center of the annulus, where the multiphase flow hits the diffuser, the horizontal velocity of the fluid appears to have increased seriously since the particles vectors are transformed vertically to horizontally and the wash water also appears to experience changes in flow (turbulence) due to hitting the tip geometry of the particle inlet channel. This is much different from the U Bulk distribution in the vertical direction (Y direction) which is relatively large or mostly colored red in the elutriation area. This happens because the U Bulk distribution in the Y direction is directly related to the wash air velocity that blows from the bottom up vertically. However, in most areas in the multiphase inlet channel before the diffuser, vertical U bulk is relatively absent because the flow of the mixture is not affected by wash air. Since the simulation results appear most informative on the horizontal line parallel to the diffuser, the graph below is presented plotting over a horizontal line at a height of 1.26 m. From this graph, the significant change in velocity in the center due to turbulence can be illustrated more clearly.
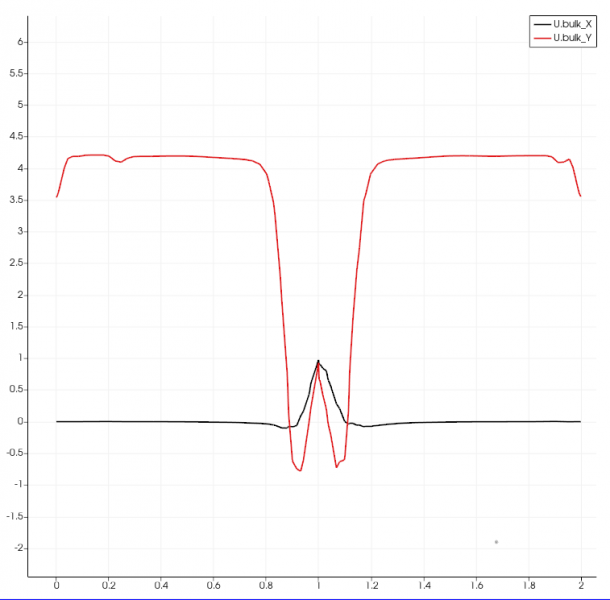
Figure 12 Horizontal Plotting of U Bulk at y = 1,26 m

Distribution of Pressure
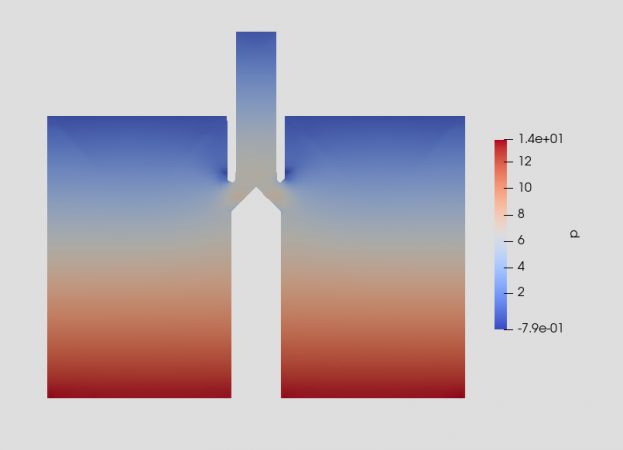
Figure 13 Distribution of Pressure

If we observed the pressure distribution in the elutriation chamber, we can see a pattern related to the relative distribution of U Bulk. In the area which constant velocity passing through, for example, if we look at the red-colored area of U Bulk distribution in the Y direction, there will be a continuous pressure drop which is indicated by a gradation color from the high-pressure area (red) to the low-pressure area (blue). The pressure distribution also increases significantly in the area around the diffuser where there is an increased U Bulk distribution in the horizontal direction. This happens due to increasing turbulence when the wash air collides with elutriator geometry and particle flow changes direction. This can be seen more clearly in the pressure graph below which is plotted horizontally at a height of 1.26 meters. From another point of view, the pressure change can also be plotted vertically on a line near the diffuser (r=0.16) and also in a line quite far from the diffuser (r=0.5). The results of these plots are shown in the graph below. From this graph, it can be understood that the pressure drop that occurs in a line far from the diffuser will constantly form a linear descending line to the right bottom (blue). However, in the line affected by the diffuser, the pressure will fluctuate exactly at the height of the diffuser and will lose pressure rapidly when there is fluid separation after turbulence with the geometry of the channel. After that, this pressure will recover and readjust to the normal linear pressure drop line.
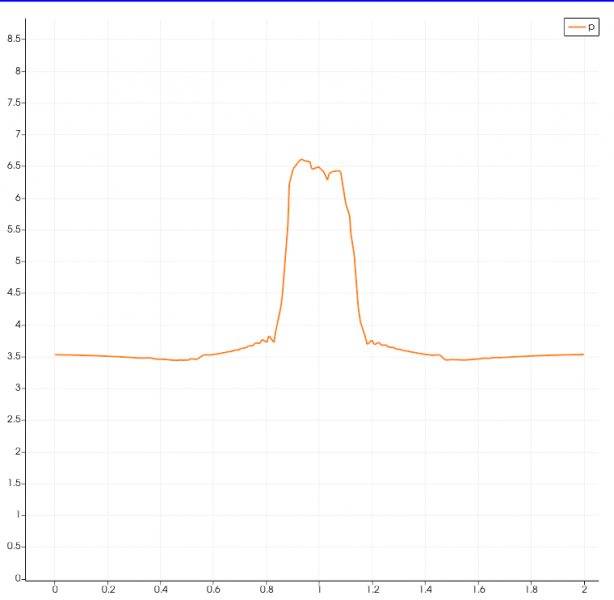
Figure 14 Horizontal Plotting of Pressure at y = 1,26 m
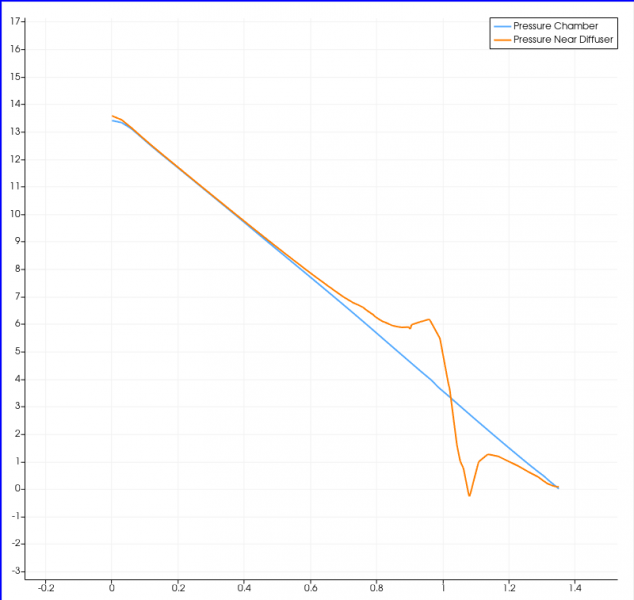
Figure 15 Vertical Plotting of Pressure at a) r = 0,16 m (blue), b) r = 0,5 m (red)


Conclusions
In conclusion, CFD simulation of elutriation using CFDSof modeling gives satisfactory results and can describe the elutriation process that occurs in the plastic industry. Even though it only tests a customized piece of apparatus rather than the entire elutriator geometry design, the simulation can capture the flow behavior of fluid inside the chamber when the density and particle diameter is varied. Since the simulation results show acceptance of the terminal velocity analysis compared to the existing literature, it is hoped that the methodology used in this study can be adopted for further research in the future
Acknowledgement
This study is a final assignment in the Computational Fluid Dynamics Application subject at the Department of Mechanical Engineering, University of Indonesia. The writer would express gratitude for Dr. Ir. Ahmad Indra Siswantara, as this paper's advisor, and also M. Hilman Gumilar Syafei, Abdullah Robanni, Bintang Farhan, Abi Rizky, Elvin, Agus P Nuryadi, Ales Daniel, and all other students for providing valuable discussion along the writing period.
References
- Avoiding ‘angel hairs’ : Plastics technology. (n.d.). Retrieved January 12, 2021, from Ptonline.com website: https://www.ptonline.com/knowledgecenter/plastics-conveying/system-design/avoid-those-devilish-angel-hairs
- Bhattacharyya, P., Singh, R., Goswami, N. G., & National Metallurgical Laboratory (India). (2000). Processing of fines : international symposium : compendium of papers.
- Frotscher, G. W. (1929). Elutriation of flotation products. Missouri University of Science and Technology.
- Lambourne, R. (Ed.). (1999). Paint and surface coatings: Theory and practice (2nd ed.). Norwich, CT: Plastics Design Library.
- Leon R. Follmer A. H. Beavers. (1973). An elutriator method for particle-size analysis with quantitative silt fractionation. Journal of Sedimentary Research, 43. doi:10.1306/74d727de-2b21-11d7-8648000102c1865d
- Minimizing Their Generation. (n.d.). Fines, angel hair and streamers: Retrieved January 12, 2021, from Ineos.com website: https://www.ineos.com/globalassets/ineos-group/businesses/ineos-olefins-and-polymers-usa/products/technical-information--patents/angel_hair_and_streamers_tech_pub.pdf
- Product cleaning. (n.d.). for the plastics industry. Retrieved January 12, 2021, from Zeppelin-systems.com website: https://www.zeppelin-systems.com/media/zeppelin-systems-18-cleaning-systems-for-the-plastics-industry.pdf
- Snider, D. M. (2001). An incompressible three-dimensional multiphase particle-in-cell model for dense particle flows. Journal of Computational Physics, 170(2), 523–549.
- Wang, Q., Melaaen, M. C., & de Silva, S. R. (2002). A computational and experimental study of fluid flow in a DE-duster. Modeling Identification and Control A Norwegian Research Bulletin, 23(1), 53–64.
- Wargadalam, V. J., Andira, M. A., Putra, C. A., Siswantara, A. I., Gunadi, G. G. R., Hariyotejo, … Aminuddin. (2019). Numerical simulation of a small-scale cyclone separator using MP-PIC method. IOP Conference Series. Materials Science and Engineering, 694, 012015.