Difference between revisions of "Fadil Naufal Wahas"
Fadil.naufal (talk | contribs) |
Fadil.naufal (talk | contribs) |
||
| Line 161: | Line 161: | ||
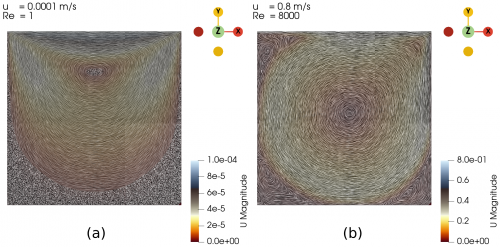
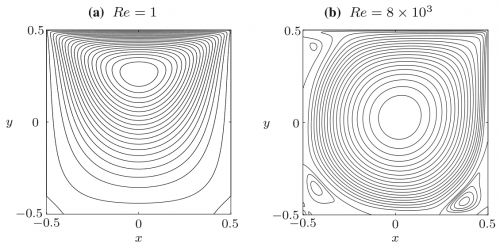
First, we validated our simulation by comparing the case with U = 0.0001 m/s and U = 0.8 m/s, hence the Re are 1 and 8000, respectively, with the case from a study conducted by Hendriketal [1], also with the same Re. The fluid flow with the isolines (streamlines) from both simulation and reference [1] can be seen in the Fig. 1 and Fig. 2 below. It can be seen that the results generated by our simulations is the same as the results obtained from [1]. | First, we validated our simulation by comparing the case with U = 0.0001 m/s and U = 0.8 m/s, hence the Re are 1 and 8000, respectively, with the case from a study conducted by Hendriketal [1], also with the same Re. The fluid flow with the isolines (streamlines) from both simulation and reference [1] can be seen in the Fig. 1 and Fig. 2 below. It can be seen that the results generated by our simulations is the same as the results obtained from [1]. | ||
| + | |||
| + | |||
| + | [[File:Sim 1vs8k.png|500px]] | ||
| + | |||
| + | |||
| + | [[File:Ref 1vs8k.png|500px]] | ||
| + | |||
The flow with Re = 1 is laminar and almost vertically symmetrical and the flow with Re = 8000 is turbulent with 3 secondary eddies in the 3 corners of the cavity. | The flow with Re = 1 is laminar and almost vertically symmetrical and the flow with Re = 8000 is turbulent with 3 secondary eddies in the 3 corners of the cavity. | ||
Next we varied the parameter of U from 0.01 m/s to 0.3 m/s with simpleFoam laminar model as per Table 1, and look at the flow profile of the cavity. The isolines can be seen at Fig. 3 to Fig. 10. | Next we varied the parameter of U from 0.01 m/s to 0.3 m/s with simpleFoam laminar model as per Table 1, and look at the flow profile of the cavity. The isolines can be seen at Fig. 3 to Fig. 10. | ||
| + | |||
| + | |||
| + | |||
| + | |||
References: | References: | ||
[1] Hendriketal ... | [1] Hendriketal ... | ||
Revision as of 14:27, 4 October 2024
Assalamu'alaikum Warahmatullahi Wabarakatuh, Salam Sejahtera untuk kita semua.
Perkenalkan, saya Fadil Naufal Wahas, NPM 2306185416, mahasiswa magister Departemen Teknik Mesin Universitas Indonesia.
Contents
Thesis
Tesis : Studi komputasi tentang pengaruh sifat fluida terhadap karakteristik counter-current flow limitation (CCFL) di 1/30 pressurized water reactor (PWR) hot leg
Thesis : Computational study of the effects of fluid properties on counter-current flow limitation (CCFL) characteristics in 1/30 pressurized water reactor (PWR) hot leg
Pembimbing : Prof. Dr. Ir. Harinaldi, M.Eng.
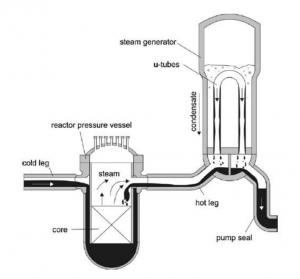
Pada kanal uap (hot leg) teras reaktor pada pembangkit listrik tenaga nuklir pressurized water reactor (PWR) terdapat fenomena counter-current flow limitation (CCFL) yang terjadi pada saat kondisi kecelakaan loss-of-coolant accident (LOCA).
Saat LOCA, karena adanya penurunan tekanan, terjadi penguapan air pendingin yang berada di reaktor sehingga uap tersebut mengalir ke steam generator (SG) melalui hot leg. Sebagian uap yang terkumpul di SG tersebut mengalami kondensasi menjadi air. Air tersebut, dipengaruhi gravitasi, mengalir kembali ke reaktor, berlawanan arah dengan uap. Aliran berlawanan arah ini terjadi saat kecepatan aliran uap berada di bawah ambang batas flooding atau counter-current flow limitation (CCFL).
Fenomena CCFL ini menjadi penting untuk diteliti karena berhubungan dengan keselamatan reaktor nuklir. Oleh karena itu, pengaruh sifat fisik fluida terhadap karakteristik CCFL perlu diinvestigasi.
DAI5 Framework
DAI5 Framework is a guideline developed by Dr. Ahmad Indra Siswantara for problem-solving processes. This video essay is my interpretation of the DAI5 Framework.
Computational Fluid Dynamics (CFD)
Convergence and Grid Independence
The two aspects that characterize a successful simulation result are convergence and grid independence. A converged solution have very small residuals – measures of the overall conservation of the flow properties.
The only way to eliminate errors due to coarseness of a grid is to perform a grid dependence study, which is a procedure of successive refinement of an initially coarse grid until certain key results do not change. Then the simulation is grid independent. A systematic search for convergent and grid-independent results forms an essential part of all high-quality CFD studies.
Reference: H. K. Versteeg and W. Malalasekera, An Introduction to Computational Fluid Dynamics: The Finite Volume Method. 2nd Edition. England: Pearson, 2007.
Cavity 2D Laminar Flow with CFDSOF
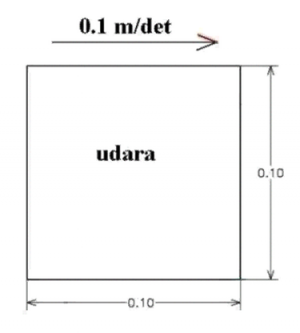
The image below shows a 0.1 m by 0.1 m cavity section filled with air (udara) where the upper wall is moving in the +x-axis direction at 0.1 m/s where the density (ρ) of air is 1 kg/m^3, the dynamic viscosity (µ) of air is 2 * 10^-5 kg/m-s, and the flow is laminar, i.e. Re = 500.
The grid-structured *CFDSOF* software is used in this simulation case.
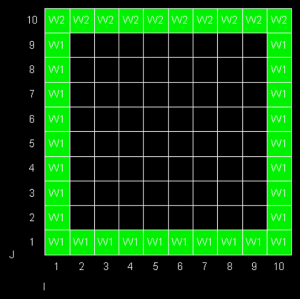
First, cavity is discritized by dividing it into cells, in this case, a 10x10 cells.
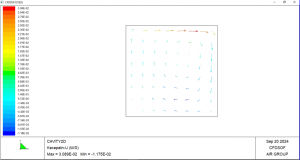
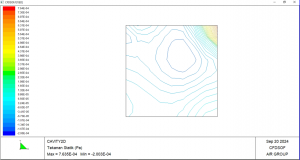
Then, after specifying the boundary condition of the walls and the iteration of the case, the iteration begins. The results of the velocity vector field and the pressure contour are shown in the images below.
It can be shown that the air is indeed moving inside the cavity and the air that is closest to the upper wall is also moving with the greatest magnitude. From the pressure contour, it can be seen that the upper-most-right corner has the greatest pressure. This is due to the fact that air is colliding at that corner and is diverted to the adjacent bottom. This collision occurs at the 4 corners of the wall, thus creating the swirling effect with the smallest velocity magnitude at the center of the swirl.
OpenFOAM Solvers
Here are solvers that OpenFOAM offers. The table below classifies the solver based on the flow of the fluid and depends on the case-by-case problem.
| No. | Solver | Algorithm | Time | Flow | Compressibility | Phase |
|---|---|---|---|---|---|---|
| 1 | simpleFoam | SIMPLE | Steady-State | Laminar/Turbulent | Incompressible | Single-phase |
| 2 | icoFoam | PISO | Transient | Laminar | Incompressible | Single-phase |
| 3 | pisoFoam | PISO | Transient | Turbulent | Incompressible | Single-phase |
| 4 | pimpleFoam | PISO+SIMPLE | Transient | Turbulent | Incompressible | Single-phase |
| 5 | interFoam | PISO+SIMPLE | Transient | Turbulent | Incompressible | Multi-phase |
| 6 | - | - | - | - | - | - |
SIMPLE = Semi-Implicit Method for Pressure Linked Equations
PISO = Pressure Implicit with Splitting of Operators
Cavity 2D with OpenFOAM
The problem we are trying to solve is lid-driven cavity. Same as previous case, the geometry is a 2 dimensional 0.1 m by 0.1 m (gamma = Lx/Ly = 1) cavity space with the upper wall moving to the positive x-axis direction at certain velocities. The boundary of right, left, and lower wall is stationary. The fluid is air with kinematic viscosity (nu) of 1 * 10-⁵ m²/s.
The INTENTION of this preliminary study is to understand the effect of Reynolds number (Re) on the air flow inside the lid-driven cavity, particularly the flow profile. At certain velocity, is it laminar, transitional, or turbulent? At what Reynolds number does the change occurs?
Re = rho.U.L/mu = U . L / nu (1)
where: Re = Reynolds number (-) rho = fluid density (kg/m³) U = inlet velocity = upper wall velocity (m/s) L = characteristic length = wall length = 0.1 m mu = dynamic viscosity (kg/m-s) nu = kinematic viscosity = 1 * 10-⁵ (m²/s)
Reynolds number can be calculated using the Eq. (1). We can vary the Reynolds number by varying the wall velocity. Here, the upper wall velocity is varied from 0.0001 m/s to 0.8 m/s with various increment. The wall velocity variation is presented at the table below.
| U (m/s) | Re (-) |
|---|---|
| 0.0001 | 1 |
| 0.01 | 100 |
| 0.02 | 200 |
| 0.03 | 300 |
| 0.04 | 400 |
| 0.05 | 500 |
| 0.1 | 1000 |
| 0.2 | 2000 |
| 0.3 | 3000 |
| 0.8 | 8000 |
We used the open-source CFD software OpenFOAM for this study with simpleFoam solver for both laminar and turbulent flow, with the latter using the k-Omega turbulence model. The flow was assumed to be steady-state. A 50 by 50 hexahedral grid mesh was used in the model, where the z-axis was set to 1 cell to represent the 2 dimensional case.
First, we validated our simulation by comparing the case with U = 0.0001 m/s and U = 0.8 m/s, hence the Re are 1 and 8000, respectively, with the case from a study conducted by Hendriketal [1], also with the same Re. The fluid flow with the isolines (streamlines) from both simulation and reference [1] can be seen in the Fig. 1 and Fig. 2 below. It can be seen that the results generated by our simulations is the same as the results obtained from [1].
The flow with Re = 1 is laminar and almost vertically symmetrical and the flow with Re = 8000 is turbulent with 3 secondary eddies in the 3 corners of the cavity.
Next we varied the parameter of U from 0.01 m/s to 0.3 m/s with simpleFoam laminar model as per Table 1, and look at the flow profile of the cavity. The isolines can be seen at Fig. 3 to Fig. 10.
References: [1] Hendriketal ...
