Difference between revisions of "Thermal Dispersion Study"
| (4 intermediate revisions by the same user not shown) | |||
| Line 1: | Line 1: | ||
| + | Cahya Amalinadhi Putra | ||
| − | + | ||
| + | = Abstract = | ||
Cooling water outfalls of a power plant is one of the engineering applications of discharge that mostly found in coastal areas. It contains buoyant turbulent jets phenomenon that depends on geometry configuration, discharge momentum, and its temperature. Further, thermal dispersion is one of the most critical phenomena that have to be analyzed thoroughly because it directly affects the marine ecosystem and power plant products. With its wide range application in research and engineering problems, computational fluid dynamics (CFD) simulation is done to provide a more detailed analysis of thermal dispersion. Moreover, CFD simulations of discharge are considered to be particularly challenging to perform. The momentum flux, buoyancy flux, and outfall geometry that strongly influence the buoyant jet interaction required the fine mesh to compute. Not only accuracy but also time cost is affected by the mesh. It follows that by optimizing the mesh configuration, an accurate and most economically simulation can be obtained. A three-dimensional model of turbulent jets discharge into stationary ambient seawater is presented in this paper to study certain mesh grading variation that has not been employed before. The simulation is limited only to the near-field area. It is found that mesh with its grading is centered near the outfall could increase the accuracy of the simulation without increasing the number of mesh elements. | Cooling water outfalls of a power plant is one of the engineering applications of discharge that mostly found in coastal areas. It contains buoyant turbulent jets phenomenon that depends on geometry configuration, discharge momentum, and its temperature. Further, thermal dispersion is one of the most critical phenomena that have to be analyzed thoroughly because it directly affects the marine ecosystem and power plant products. With its wide range application in research and engineering problems, computational fluid dynamics (CFD) simulation is done to provide a more detailed analysis of thermal dispersion. Moreover, CFD simulations of discharge are considered to be particularly challenging to perform. The momentum flux, buoyancy flux, and outfall geometry that strongly influence the buoyant jet interaction required the fine mesh to compute. Not only accuracy but also time cost is affected by the mesh. It follows that by optimizing the mesh configuration, an accurate and most economically simulation can be obtained. A three-dimensional model of turbulent jets discharge into stationary ambient seawater is presented in this paper to study certain mesh grading variation that has not been employed before. The simulation is limited only to the near-field area. It is found that mesh with its grading is centered near the outfall could increase the accuracy of the simulation without increasing the number of mesh elements. | ||
| − | + | = Introduction = | |
| − | + | == Cooling Water Outfalls == | |
Thermal or chemical pollutants often discharges to the ocean through outfalls of power plant stations. This activity leads to several changes of condition in the ambient, one of them is the rising of seawater temperature. Consequently, this phenomenon could potentially endanger the seawater ecosystem as well as disturbing the production activity of power plant stations due to the increasing temperature of intake seawater. To overcome those problems, a careful assessment must be done to provide a thorough analysis. | Thermal or chemical pollutants often discharges to the ocean through outfalls of power plant stations. This activity leads to several changes of condition in the ambient, one of them is the rising of seawater temperature. Consequently, this phenomenon could potentially endanger the seawater ecosystem as well as disturbing the production activity of power plant stations due to the increasing temperature of intake seawater. To overcome those problems, a careful assessment must be done to provide a thorough analysis. | ||
The thermal dispersion of discharge occurs in a wide range area. The region close to the outfalls, called by near-field region, that can be characterized as turbulent buoyant jets (Veld, 2013) which the momentum and buoyancy effect are governed the mixing process (Robinson, Wood, Piggott, & Gorman, 2015). Moreover, the discharge in this region form a jet-like flow due to its momentum dominance, however, it becomes plume-like flow when as initial momentum is dissipated and buoyancy dominated. | The thermal dispersion of discharge occurs in a wide range area. The region close to the outfalls, called by near-field region, that can be characterized as turbulent buoyant jets (Veld, 2013) which the momentum and buoyancy effect are governed the mixing process (Robinson, Wood, Piggott, & Gorman, 2015). Moreover, the discharge in this region form a jet-like flow due to its momentum dominance, however, it becomes plume-like flow when as initial momentum is dissipated and buoyancy dominated. | ||
| − | + | == Theory of Jets and Plumes == | |
The theory about jets-like and plume-like behavior are summarized briefly by Fischer (Fischer, 1979) and Lee and Chu (Lee & Chu, 2003) research. According to Fischer, a pure jet is typically considered as a flow from an orifice with a pure momentum source. He formulated three basic dimensional numbers such as the volume flux, momentum flux, and buoyancy flux to define the influence of momentum and buoyancy force. | The theory about jets-like and plume-like behavior are summarized briefly by Fischer (Fischer, 1979) and Lee and Chu (Lee & Chu, 2003) research. According to Fischer, a pure jet is typically considered as a flow from an orifice with a pure momentum source. He formulated three basic dimensional numbers such as the volume flux, momentum flux, and buoyancy flux to define the influence of momentum and buoyancy force. | ||
| Line 25: | Line 27: | ||
To enrich the understanding of the flow behavior, some researchers had conducted laboratory experiments. One of the studies divides the development of a pure jet into two stages (Albertson, Dal, Jensen, & Rouse, 1950), the zone of the establishment (ZFE) and the zone of established flow (ZEF). Within the ZFE, the jet forms a core that the size of the core is decreasing further from the outfalls. While the core is decreasing, the mixing layer starts to grow. The jet is called fully developed when the mixing layer grows up to the center of the jet. From the experiment, the length of the ZFE is approximately equal to 6.2D. Further than that, the flow enter the ZEF region and assumed to be fully developed. Its axial velocity and concentration profiles are similar to Gaussian distribution (Albertson, Dal, Jensen, & Rouse, 1950). | To enrich the understanding of the flow behavior, some researchers had conducted laboratory experiments. One of the studies divides the development of a pure jet into two stages (Albertson, Dal, Jensen, & Rouse, 1950), the zone of the establishment (ZFE) and the zone of established flow (ZEF). Within the ZFE, the jet forms a core that the size of the core is decreasing further from the outfalls. While the core is decreasing, the mixing layer starts to grow. The jet is called fully developed when the mixing layer grows up to the center of the jet. From the experiment, the length of the ZFE is approximately equal to 6.2D. Further than that, the flow enter the ZEF region and assumed to be fully developed. Its axial velocity and concentration profiles are similar to Gaussian distribution (Albertson, Dal, Jensen, & Rouse, 1950). | ||
| − | + | == CFD Research and Exploitation Proposal == | |
Dealing with the near-field region, many studies have been done by CFD to predict how the jet behaves. Robinson et. al. (Robinson, Wood, Piggott, & Gorman, 2015) studied the jet behavior at the near-field region by CFD and compared it with CorJet integral model (Jirka, 2004). They obtained good agreement with the comparison model. The same result is also obtained by Veld (Veld, 2013). The verification process showed good agreement compared with several experimental studies. | Dealing with the near-field region, many studies have been done by CFD to predict how the jet behaves. Robinson et. al. (Robinson, Wood, Piggott, & Gorman, 2015) studied the jet behavior at the near-field region by CFD and compared it with CorJet integral model (Jirka, 2004). They obtained good agreement with the comparison model. The same result is also obtained by Veld (Veld, 2013). The verification process showed good agreement compared with several experimental studies. | ||
Further, a question arises on how robust the CFD solution is when it is used in the real object or industrial/engineering needs. The needs of accuracy have to be compromised with the time-cost simulation. The mesh configurations are parameters that directly affect the accuracy and time-cost of the simulation. On previous research conducted by some researchers, some of them stated how they created their mesh, the others are not. | Further, a question arises on how robust the CFD solution is when it is used in the real object or industrial/engineering needs. The needs of accuracy have to be compromised with the time-cost simulation. The mesh configurations are parameters that directly affect the accuracy and time-cost of the simulation. On previous research conducted by some researchers, some of them stated how they created their mesh, the others are not. | ||
| Line 31: | Line 33: | ||
The present work will study how to increase the results accuracy by varying the mesh grading on a fixed number of elements. The analysis will be done by CFD and use SST k-omega as the turbulence model. Later, the results will be compared with experimental studies. If the hypothesis is proven, then the CFD simulation can be done in less time but still provide good accuracy. | The present work will study how to increase the results accuracy by varying the mesh grading on a fixed number of elements. The analysis will be done by CFD and use SST k-omega as the turbulence model. Later, the results will be compared with experimental studies. If the hypothesis is proven, then the CFD simulation can be done in less time but still provide good accuracy. | ||
| − | + | = Materials and Methods = | |
| − | + | == Governing Equations == | |
As the high momentum and temperature fluid exit the outflow, the flow field is influenced by the heat and at the same time, the transport of heat is governed by the flow field. Some assumptions are used in these simulations for further elaboration of the governing equations. | As the high momentum and temperature fluid exit the outflow, the flow field is influenced by the heat and at the same time, the transport of heat is governed by the flow field. Some assumptions are used in these simulations for further elaboration of the governing equations. | ||
*The fluid is assumed to be a continuum | *The fluid is assumed to be a continuum | ||
| Line 50: | Line 52: | ||
Where β is the thermal expansion coefficient. To define the relation between momentum diffusivity and thermal diffusivity, Prandtl number Pr is introduced. | Where β is the thermal expansion coefficient. To define the relation between momentum diffusivity and thermal diffusivity, Prandtl number Pr is introduced. | ||
| − | + | == CFD Modeling == | |
To solve the flow field, the CFD method is used. CFD will discretize the fluid domain into meshes and all the governing equations are calculated within those meshes. The method starts by creating the fluid domain model. The domain volume is 50m x 50m x 30m that is filled with seawater as shown in Figure 1. The outfall is modeled as a circle with a diameter of 1 m on one side with the depth of 15 m from above surface. | To solve the flow field, the CFD method is used. CFD will discretize the fluid domain into meshes and all the governing equations are calculated within those meshes. The method starts by creating the fluid domain model. The domain volume is 50m x 50m x 30m that is filled with seawater as shown in Figure 1. The outfall is modeled as a circle with a diameter of 1 m on one side with the depth of 15 m from above surface. | ||
| − | [[File:Figure1.JPG|center | + | [[File:Figure1.JPG|center]] |
| + | <center>'''Figure 1'''</center> | ||
The ambient seawater temperature is 293.15 K with thermal expansion 300x10-6 K-1. The jet flow from outfall with a velocity of 3 m/s and temperature of 313.15 K. | The ambient seawater temperature is 293.15 K with thermal expansion 300x10-6 K-1. The jet flow from outfall with a velocity of 3 m/s and temperature of 313.15 K. | ||
| Line 59: | Line 62: | ||
Next, the grid independency test is being conducted. After finding the independent mesh, that mesh will be used in this mesh grading studies. | Next, the grid independency test is being conducted. After finding the independent mesh, that mesh will be used in this mesh grading studies. | ||
| − | + | == Mesh Grading and Study Procedures == | |
Mesh grading is defined as the ratio of the width of the end cell [[File:Delta_e.JPG]] along one edge of a block to the width of the start cell [[File:Delta_s.JPG]] along that edge. | Mesh grading is defined as the ratio of the width of the end cell [[File:Delta_e.JPG]] along one edge of a block to the width of the start cell [[File:Delta_s.JPG]] along that edge. | ||
| − | [[File:Figure2.JPG|center | + | [[File:Figure2.JPG|center]] |
| + | <center>'''Figure 2'''</center> | ||
In this research, the mesh grading is limited only on one axis that is toward the jet flow direction. The grading is concentrated on one point. The point location is varied from 0 m to 10 m from the outfall location (z = 0 m, 5 m, and 6.2 m). | In this research, the mesh grading is limited only on one axis that is toward the jet flow direction. The grading is concentrated on one point. The point location is varied from 0 m to 10 m from the outfall location (z = 0 m, 5 m, and 6.2 m). | ||
| − | + | = Results and Discussions = | |
| − | + | == Grid Verification == | |
The model was discretized using a structured-Cartesian grid in which the number of mesh is being controlled at 300,000, 500,000, and 900,000. The velocity contour on the center of the jet is chosen to verify the grid independence. | The model was discretized using a structured-Cartesian grid in which the number of mesh is being controlled at 300,000, 500,000, and 900,000. The velocity contour on the center of the jet is chosen to verify the grid independence. | ||
| − | [[File:Figure_3.png|center| | + | [[File:Figure_3.png|center|400px]] |
| + | <center>'''Figure 3'''</center> | ||
| − | [[File:Figure_4.png|center| | + | [[File:Figure_4.png|center|400px]] |
| + | <center>'''Figure 4'''</center> | ||
Figure 3 shows the line that is used to map the jet centreline. The results in Figure 4 show that the mesh is considered as independence with 500,000 number of mesh. The results similar to the ZFE region for all of the mesh. It has a difference after the ZFE region and starts aligning again. | Figure 3 shows the line that is used to map the jet centreline. The results in Figure 4 show that the mesh is considered as independence with 500,000 number of mesh. The results similar to the ZFE region for all of the mesh. It has a difference after the ZFE region and starts aligning again. | ||
| − | [[File:Figure_5a.png|center| | + | [[File:Figure_5a.png|center|400px]] |
| − | [[File:Figure_5b.png|center| | + | [[File:Figure_5b.png|center|400px]] |
| + | <center>'''Figure 5a and Figure 5b'''</center> | ||
The chosen mesh is shown in Figure 5. Furthermore, Figure 5.a shows the mesh towards flow direction. The grading is set to be uniform at first. In the other hands, Figure 5.b shows the mesh configuration facing the inlet surface. The mesh is denser toward the inlet. | The chosen mesh is shown in Figure 5. Furthermore, Figure 5.a shows the mesh towards flow direction. The grading is set to be uniform at first. In the other hands, Figure 5.b shows the mesh configuration facing the inlet surface. The mesh is denser toward the inlet. | ||
| + | |||
| + | == Mesh Grading Variation Effects == | ||
| + | The effect of mesh grading variations is observed by comparing its results to the value of ZFE’s length (Albertson, Dal, Jensen, & Rouse, 1950) and value of centerline-jet velocity from experimental studies. | ||
| + | |||
| + | === Comparison to ZFE’s Length === | ||
| + | The ZFE’s length can directly be extracted from the simulation results by creating the velocity contour on the symmetrical-normal plane downstream. Based on Albertson, the ZFE’s length is 6.2 m. | ||
| + | |||
| + | <center>'''Table 1'''</center> | ||
| + | {| class="wikitable" style="color:green; background-color:#ffffcc;" cellpadding="10"; style="margin: auto;" | ||
| + | |'''Grading centre''' | ||
| + | |'''0 m''' | ||
| + | |'''5 m''' | ||
| + | |'''6.2 m''' | ||
| + | |'''No grading''' | ||
| + | |- | ||
| + | |'''ZFE's Length''' | ||
| + | |5 m | ||
| + | |3 m | ||
| + | |2.6 m | ||
| + | |4 m | ||
| + | |- | ||
| + | |'''%Error''' | ||
| + | |19.4% | ||
| + | |52.2% | ||
| + | |58.0% | ||
| + | |35.5% | ||
| + | |} | ||
| + | |||
| + | From Table 1, the uniform grading gave ZFE’s length of 4 m. It has an error of 35.5% compared to Albertson experiment. When the grading is centered on point 0 m, the ZFE’s length change to 5 m which gives a reduction of the error to ZFE’s experimental length. The location of grading was increased until it approaches the experimental ZFE’s length value, but the ZFE’s length from the experiment deviate bigger than at 0 m. This mesh grading variation shows a big influence on the results in a fixed number of mesh elements. Below are some pictures of mesh grading located at 0 m, 5 m, and 6.2 m. | ||
| + | |||
| + | [[File:Figure_6a.png|center|400px]] | ||
| + | [[File:Figure_6b.png|center|400px]] | ||
| + | [[File:Figure_6c.png|center|400px]] | ||
| + | <center>'''Figure 6a, 6b, and 6c'''</center> | ||
| + | |||
| + | Figure 6.a, 6.b, and 6.c show the mesh visualization for grading center at 0 m, 5 m, and 6.2 m respectively. Figure 6.a clearly shows the mesh is well refined near the outfall. This region needs fine mesh because of the fluid entrance to the ambient seawater from this location. However, based on the near-field region theory, there is a location where the flow change from jet-like to plume-like, it is at 6.2 m (around ZFE’s length). The grid center is directed toward those points. However, the results are not good. The source of error might arise from the mesh configuration. As seen in Figure 6.b and 6.c, the mesh between outfall and grading center is less dense compared to the mesh after the grading center. The big size mesh after the outfall is not needed because it obtains bigger calculation errors. | ||
| + | |||
| + | === Comparison to Centerline-Jet Velocity === | ||
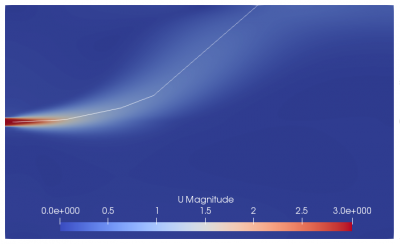
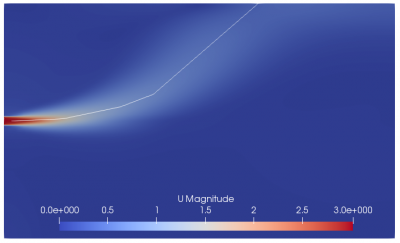
| + | The centerline-jet velocity is also compared because there are some experimental studies that recorded it such as from (Albertson, Dal, Jensen, & Rouse, 1950), (Rosler & Bankoff, 1963), and (Labus, Symons, & Center, 1972). Noted that there is no detail information of centerline coordinates, hence the centerline coordinates are drawn by looking at the velocity contour. Below is the figure of velocity contour and centerline coordinates. | ||
| + | |||
| + | [[File:Figure_7a.png|center|400px]] | ||
| + | [[File:Figure_7b.png|center|400px]] | ||
| + | [[File:Figure_7c.png|center|400px]] | ||
| + | <center>'''Figure 7a, 7b, and 7c'''</center> | ||
| + | |||
| + | Figure 7.a, 7.b, and 7.c, show the velocity contour and centerline of the jet that was drawn of grading center 0 m, 5 m, and 6.2 m, respectively. The fine mesh forms longer jet than the others. | ||
| + | |||
| + | [[File:Figure_8.png|center|400px]] | ||
| + | <center>'''Figure 8'''</center> | ||
| + | |||
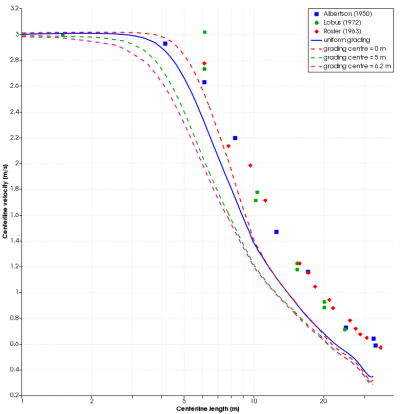
| + | Furthermore, Figure 8 shows the centerline velocity values. The effect of mesh with grading center at 0 m shows a better accuracy compare to others. However, the development of accuracy is not global, only around the first 6 m. Further than that, accuracy keep decreasing gradually. Moreover, the mesh with the grading center at 5 m and 6.2 m produce worse results from outfall to downstream jet directions. Although all the results show different accuracy, from the length of 9 m to the end of the centerline lengths (near the sea surface), all of the simulation results converge into a single value. This problem might be arose due to the grading and mesh discretization along the depth axis that is not being manipulated in this study. | ||
| + | |||
| + | === Update Study === | ||
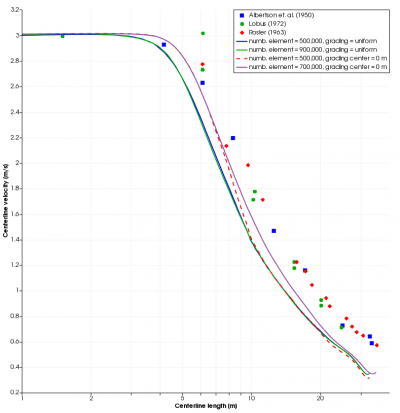
| + | From the latest study, we found that the mesh grading configuration in one axis only improve the solution locally. There is a potential improvement if we configure the mesh grading on the other axis too. Hence, we change the mesh grading along the vertical axis and add several number of meshes. The result shows good improvement to the solution. | ||
| + | |||
| + | [[File:Update-results.PNG|center|400px]] | ||
| + | <center>'''Figure 9'''</center> | ||
| + | |||
| + | = Conclusion = | ||
| + | This current study has investigated the modification of mesh grading in order to increase the simulation accuracy on thermal dispersion case. The results show that mesh with grading center at 0 m obtain better accuracy locally. However, all the grading center variation failed to provide better global accuracy. The source of error might come from the grading configuration on other axis (depth axis for example) in which is less fine compared to flow direction axis. A following study should be done to gain more understanding about the mesh grading on different axis or more than one axis. | ||
| + | |||
| + | = Acknowledgements = | ||
| + | |||
| + | = References = | ||
| + | *Albertson, M., Dal, Y., Jensen, R., & Rouse, H. (1950). Diffusion of Submerged Jets. Trans, ASCE. | ||
| + | *Fischer, H. (1979). Mixing in Inland and Coastal Waters. Number v. 1. Academic Press. | ||
| + | *Jirka, G. (2004). Integral Model for Turbulent Buoyant Jets in Unbounded Stratified Flows. Part I: Single Round Jet. Environ Fluid Mech. | ||
| + | *Labus, T., Symons, E., & Center, L. R. (1972). Experimental Investigation of an Axisymmetric Free Jet with an Initially Uniform Velocity Profile. NASA technical notes. | ||
| + | *Lee, J., & Chu, V. (2003). Turbulent Jets and Plumes: A Lagrangian Approach. Number v. 1. Kluwer Academic Publishers. | ||
| + | *Robinson, D., Wood, M., Piggott, M., & Gorman, G. (2015). CFD Modelling of Marine Discharge Mixing and Dispersion. Journal of Applied Water Engineering and Research. | ||
| + | *Rosler, R. S., & Bankoff, S. G. (1963). Large-scale Turbulence Characteristics of a Submerged Water Jet. AIChE Journal, 672-676. | ||
| + | *Veld, R. o. (2013). Temperature Distribution of Shallow Water FLNG Cooling Water Outfalls. | ||
Latest revision as of 13:18, 11 September 2019
Cahya Amalinadhi Putra
Contents
Abstract
Cooling water outfalls of a power plant is one of the engineering applications of discharge that mostly found in coastal areas. It contains buoyant turbulent jets phenomenon that depends on geometry configuration, discharge momentum, and its temperature. Further, thermal dispersion is one of the most critical phenomena that have to be analyzed thoroughly because it directly affects the marine ecosystem and power plant products. With its wide range application in research and engineering problems, computational fluid dynamics (CFD) simulation is done to provide a more detailed analysis of thermal dispersion. Moreover, CFD simulations of discharge are considered to be particularly challenging to perform. The momentum flux, buoyancy flux, and outfall geometry that strongly influence the buoyant jet interaction required the fine mesh to compute. Not only accuracy but also time cost is affected by the mesh. It follows that by optimizing the mesh configuration, an accurate and most economically simulation can be obtained. A three-dimensional model of turbulent jets discharge into stationary ambient seawater is presented in this paper to study certain mesh grading variation that has not been employed before. The simulation is limited only to the near-field area. It is found that mesh with its grading is centered near the outfall could increase the accuracy of the simulation without increasing the number of mesh elements.
Introduction
Cooling Water Outfalls
Thermal or chemical pollutants often discharges to the ocean through outfalls of power plant stations. This activity leads to several changes of condition in the ambient, one of them is the rising of seawater temperature. Consequently, this phenomenon could potentially endanger the seawater ecosystem as well as disturbing the production activity of power plant stations due to the increasing temperature of intake seawater. To overcome those problems, a careful assessment must be done to provide a thorough analysis. The thermal dispersion of discharge occurs in a wide range area. The region close to the outfalls, called by near-field region, that can be characterized as turbulent buoyant jets (Veld, 2013) which the momentum and buoyancy effect are governed the mixing process (Robinson, Wood, Piggott, & Gorman, 2015). Moreover, the discharge in this region form a jet-like flow due to its momentum dominance, however, it becomes plume-like flow when as initial momentum is dissipated and buoyancy dominated.
Theory of Jets and Plumes
The theory about jets-like and plume-like behavior are summarized briefly by Fischer (Fischer, 1979) and Lee and Chu (Lee & Chu, 2003) research. According to Fischer, a pure jet is typically considered as a flow from an orifice with a pure momentum source. He formulated three basic dimensional numbers such as the volume flux, momentum flux, and buoyancy flux to define the influence of momentum and buoyancy force.
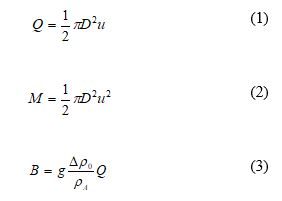
From equation (1) to (3), Q, M, and B are volume flux, momentum flux, and buoyancy flux respectively. Further, u is the discharge velocity, D is the outfall diameter, g is the acceleration due to gravity, is the ambient (seawater) density, and
is the initial density differences between the fluid that exit from the outfall and the ambient fluid. These three terms are combined to define two non-dimensional path-lengths.
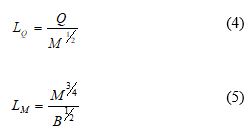
Where and
area volume length scale and momentum length scale respectively. These length scales will provide useful insight into the dominant processes along the jet trajectory. From equation (4), it becomes clear that
is only depending on the jet geometry. For distances
, the initial outfall geometry has the largest effect on the jet flow, on the other hand, where
, the volume flux becomes less important and the jet is mostly influenced by the initial momentum (Veld, 2013). This distance also makes the flow fully developed. Further, the momentum length scale consists of both momentum- and buoyancy flux. The momentum length scale measures the distance where buoyancy effects become more important than the jet momentum. Research conducted by Veld (2013) proves that momentum length scale is a very important parameter to characterize buoyant jets.
Another important non-dimensional parameter is densimetric Froude number () which gives the hint whether the flow is more jet-like (
) or plume-like (
). The initial densimetric Froude number is given by:
To enrich the understanding of the flow behavior, some researchers had conducted laboratory experiments. One of the studies divides the development of a pure jet into two stages (Albertson, Dal, Jensen, & Rouse, 1950), the zone of the establishment (ZFE) and the zone of established flow (ZEF). Within the ZFE, the jet forms a core that the size of the core is decreasing further from the outfalls. While the core is decreasing, the mixing layer starts to grow. The jet is called fully developed when the mixing layer grows up to the center of the jet. From the experiment, the length of the ZFE is approximately equal to 6.2D. Further than that, the flow enter the ZEF region and assumed to be fully developed. Its axial velocity and concentration profiles are similar to Gaussian distribution (Albertson, Dal, Jensen, & Rouse, 1950).
CFD Research and Exploitation Proposal
Dealing with the near-field region, many studies have been done by CFD to predict how the jet behaves. Robinson et. al. (Robinson, Wood, Piggott, & Gorman, 2015) studied the jet behavior at the near-field region by CFD and compared it with CorJet integral model (Jirka, 2004). They obtained good agreement with the comparison model. The same result is also obtained by Veld (Veld, 2013). The verification process showed good agreement compared with several experimental studies. Further, a question arises on how robust the CFD solution is when it is used in the real object or industrial/engineering needs. The needs of accuracy have to be compromised with the time-cost simulation. The mesh configurations are parameters that directly affect the accuracy and time-cost of the simulation. On previous research conducted by some researchers, some of them stated how they created their mesh, the others are not. It is not a novelty idea on increasing the accuracy without increasing the number of mesh. However, it has not been done in the research of near-field thermal dispersion. The hypothesis starts with changing the mesh grading to gain more accurate results. On Veld (2013), the grading is set finer toward the outfall. However, it could not reach a good accuracy when the number of mesh is decreased. There have to be some ways to exploit the grading configuration to increase accuracy. The present work will study how to increase the results accuracy by varying the mesh grading on a fixed number of elements. The analysis will be done by CFD and use SST k-omega as the turbulence model. Later, the results will be compared with experimental studies. If the hypothesis is proven, then the CFD simulation can be done in less time but still provide good accuracy.
Materials and Methods
Governing Equations
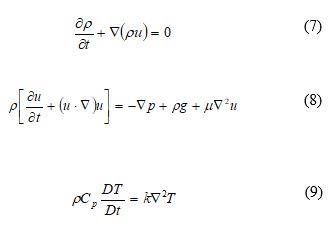
As the high momentum and temperature fluid exit the outflow, the flow field is influenced by the heat and at the same time, the transport of heat is governed by the flow field. Some assumptions are used in these simulations for further elaboration of the governing equations.
- The fluid is assumed to be a continuum
- Incompressible fluid for pressure
- Isotropic
- Constant dynamic viscosity
The flow field is governed by three physical conservation laws such as conservation of mass, momentum, and energy.
Due to the high velocities gradients at the point where the jet enters the ambient fluid, turbulence is introduced into the ambient fluid. Consequently, the jet velocities will fluctuate over time. The SST k-ω turbulence model is employed to construct the mean and fluctuating velocities. According to the assumptions, the density will only change because of the change of temperature. The Boussinesq assumption was used to re-construct the continuity and momentum equation. The density ρ in the gravitational terms is expressed by the linear function of the temperature Τ:
Where β is the thermal expansion coefficient. To define the relation between momentum diffusivity and thermal diffusivity, Prandtl number Pr is introduced.
CFD Modeling
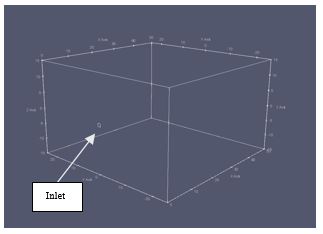
To solve the flow field, the CFD method is used. CFD will discretize the fluid domain into meshes and all the governing equations are calculated within those meshes. The method starts by creating the fluid domain model. The domain volume is 50m x 50m x 30m that is filled with seawater as shown in Figure 1. The outfall is modeled as a circle with a diameter of 1 m on one side with the depth of 15 m from above surface.
The ambient seawater temperature is 293.15 K with thermal expansion 300x10-6 K-1. The jet flow from outfall with a velocity of 3 m/s and temperature of 313.15 K. The computational domain contains six boundary patches, namely inlet, outlet, wall, sea-surface, bottom, and sides. The top part of the domain was sea-surface that is defined as a slip wall. It assumed that there is no heat flux into the seawater from sun radiation. The inlet is where the outfall is. On the same surface at inlet, the wall is defined and applied as a no-slip wall. The bottom surface is located at the bottom of the fluid domain. It is defined as a no-slip wall. Moreover, the outlet is on the opposite surface from the inlet and wall. It is defined as one direction flow boundary. The last is sides, located on the right and left the surface. It is defined as an open boundary where fluid can flow in and out through these surfaces. Next, the grid independency test is being conducted. After finding the independent mesh, that mesh will be used in this mesh grading studies.
Mesh Grading and Study Procedures
Mesh grading is defined as the ratio of the width of the end cell along one edge of a block to the width of the start cell
along that edge.
In this research, the mesh grading is limited only on one axis that is toward the jet flow direction. The grading is concentrated on one point. The point location is varied from 0 m to 10 m from the outfall location (z = 0 m, 5 m, and 6.2 m).
Results and Discussions
Grid Verification
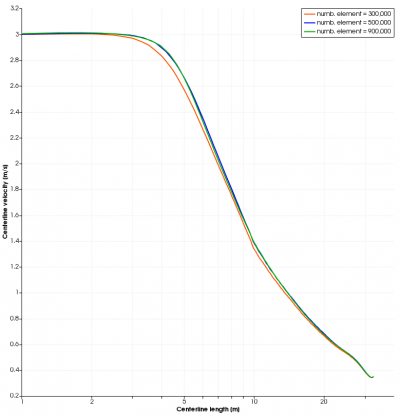
The model was discretized using a structured-Cartesian grid in which the number of mesh is being controlled at 300,000, 500,000, and 900,000. The velocity contour on the center of the jet is chosen to verify the grid independence.
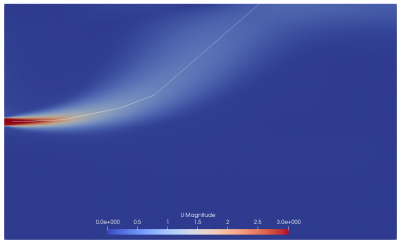
Figure 3 shows the line that is used to map the jet centreline. The results in Figure 4 show that the mesh is considered as independence with 500,000 number of mesh. The results similar to the ZFE region for all of the mesh. It has a difference after the ZFE region and starts aligning again.
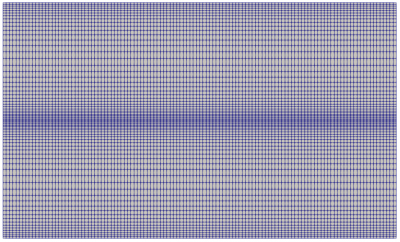
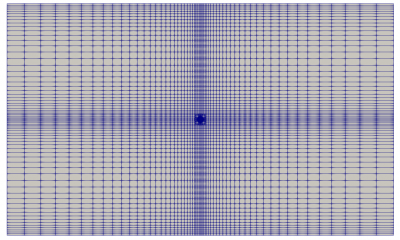
The chosen mesh is shown in Figure 5. Furthermore, Figure 5.a shows the mesh towards flow direction. The grading is set to be uniform at first. In the other hands, Figure 5.b shows the mesh configuration facing the inlet surface. The mesh is denser toward the inlet.
Mesh Grading Variation Effects
The effect of mesh grading variations is observed by comparing its results to the value of ZFE’s length (Albertson, Dal, Jensen, & Rouse, 1950) and value of centerline-jet velocity from experimental studies.
Comparison to ZFE’s Length
The ZFE’s length can directly be extracted from the simulation results by creating the velocity contour on the symmetrical-normal plane downstream. Based on Albertson, the ZFE’s length is 6.2 m.
| Grading centre | 0 m | 5 m | 6.2 m | No grading |
| ZFE's Length | 5 m | 3 m | 2.6 m | 4 m |
| %Error | 19.4% | 52.2% | 58.0% | 35.5% |
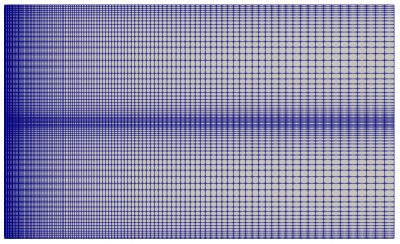
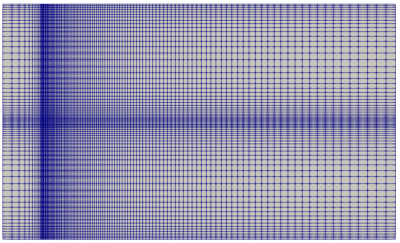
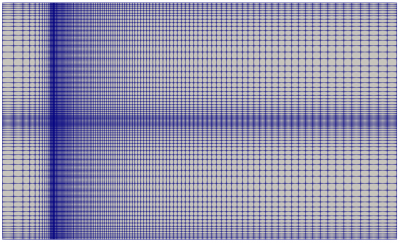
From Table 1, the uniform grading gave ZFE’s length of 4 m. It has an error of 35.5% compared to Albertson experiment. When the grading is centered on point 0 m, the ZFE’s length change to 5 m which gives a reduction of the error to ZFE’s experimental length. The location of grading was increased until it approaches the experimental ZFE’s length value, but the ZFE’s length from the experiment deviate bigger than at 0 m. This mesh grading variation shows a big influence on the results in a fixed number of mesh elements. Below are some pictures of mesh grading located at 0 m, 5 m, and 6.2 m.
Figure 6.a, 6.b, and 6.c show the mesh visualization for grading center at 0 m, 5 m, and 6.2 m respectively. Figure 6.a clearly shows the mesh is well refined near the outfall. This region needs fine mesh because of the fluid entrance to the ambient seawater from this location. However, based on the near-field region theory, there is a location where the flow change from jet-like to plume-like, it is at 6.2 m (around ZFE’s length). The grid center is directed toward those points. However, the results are not good. The source of error might arise from the mesh configuration. As seen in Figure 6.b and 6.c, the mesh between outfall and grading center is less dense compared to the mesh after the grading center. The big size mesh after the outfall is not needed because it obtains bigger calculation errors.
Comparison to Centerline-Jet Velocity
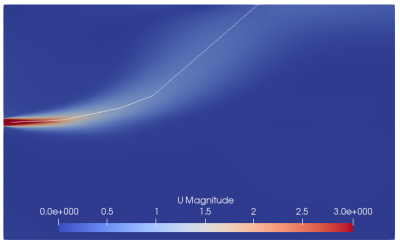
The centerline-jet velocity is also compared because there are some experimental studies that recorded it such as from (Albertson, Dal, Jensen, & Rouse, 1950), (Rosler & Bankoff, 1963), and (Labus, Symons, & Center, 1972). Noted that there is no detail information of centerline coordinates, hence the centerline coordinates are drawn by looking at the velocity contour. Below is the figure of velocity contour and centerline coordinates.
Figure 7.a, 7.b, and 7.c, show the velocity contour and centerline of the jet that was drawn of grading center 0 m, 5 m, and 6.2 m, respectively. The fine mesh forms longer jet than the others.
Furthermore, Figure 8 shows the centerline velocity values. The effect of mesh with grading center at 0 m shows a better accuracy compare to others. However, the development of accuracy is not global, only around the first 6 m. Further than that, accuracy keep decreasing gradually. Moreover, the mesh with the grading center at 5 m and 6.2 m produce worse results from outfall to downstream jet directions. Although all the results show different accuracy, from the length of 9 m to the end of the centerline lengths (near the sea surface), all of the simulation results converge into a single value. This problem might be arose due to the grading and mesh discretization along the depth axis that is not being manipulated in this study.
Update Study
From the latest study, we found that the mesh grading configuration in one axis only improve the solution locally. There is a potential improvement if we configure the mesh grading on the other axis too. Hence, we change the mesh grading along the vertical axis and add several number of meshes. The result shows good improvement to the solution.
Conclusion
This current study has investigated the modification of mesh grading in order to increase the simulation accuracy on thermal dispersion case. The results show that mesh with grading center at 0 m obtain better accuracy locally. However, all the grading center variation failed to provide better global accuracy. The source of error might come from the grading configuration on other axis (depth axis for example) in which is less fine compared to flow direction axis. A following study should be done to gain more understanding about the mesh grading on different axis or more than one axis.
Acknowledgements
References
- Albertson, M., Dal, Y., Jensen, R., & Rouse, H. (1950). Diffusion of Submerged Jets. Trans, ASCE.
- Fischer, H. (1979). Mixing in Inland and Coastal Waters. Number v. 1. Academic Press.
- Jirka, G. (2004). Integral Model for Turbulent Buoyant Jets in Unbounded Stratified Flows. Part I: Single Round Jet. Environ Fluid Mech.
- Labus, T., Symons, E., & Center, L. R. (1972). Experimental Investigation of an Axisymmetric Free Jet with an Initially Uniform Velocity Profile. NASA technical notes.
- Lee, J., & Chu, V. (2003). Turbulent Jets and Plumes: A Lagrangian Approach. Number v. 1. Kluwer Academic Publishers.
- Robinson, D., Wood, M., Piggott, M., & Gorman, G. (2015). CFD Modelling of Marine Discharge Mixing and Dispersion. Journal of Applied Water Engineering and Research.
- Rosler, R. S., & Bankoff, S. G. (1963). Large-scale Turbulence Characteristics of a Submerged Water Jet. AIChE Journal, 672-676.
- Veld, R. o. (2013). Temperature Distribution of Shallow Water FLNG Cooling Water Outfalls.
