Difference between revisions of "Ardaffa Kemal Rasha"
| Line 59: | Line 59: | ||
A temperature–entropy diagram, or T–s diagram, is a thermodynamic diagram used in thermodynamics to visualize changes to temperature and specific entropy during a thermodynamic process or cycle as the graph of a curve. It is a useful and common tool, particularly because it helps to visualize the heat transfer during a process. For reversible (ideal) processes, the area under the T–s curve of a process is the heat transferred to the system during that process. | A temperature–entropy diagram, or T–s diagram, is a thermodynamic diagram used in thermodynamics to visualize changes to temperature and specific entropy during a thermodynamic process or cycle as the graph of a curve. It is a useful and common tool, particularly because it helps to visualize the heat transfer during a process. For reversible (ideal) processes, the area under the T–s curve of a process is the heat transferred to the system during that process. | ||
| − | '''3 | + | '''3 March 2021''' |
| + | |||
| + | On today's class we discuss about entropy and enthalpy. | ||
| + | |||
| + | Entropy is a scientific concept, as well as a measurable physical property that is most commonly associated with a state of disorder, randomness, or uncertainty. | ||
| + | Entropy formula: ΔS = ΔQ / T | ||
| + | where: ΔS is change of entropy (joule/kelvin) | ||
| + | ΔQ is change of heat (joule) | ||
| + | T is temperature (kelvin) | ||
| + | |||
| + | Enthalpy is a property of a thermodynamic system, defined as the sum of the system's internal energy and the product of its pressure and volume. It is a convenient state function standardly used in many measurements in chemical, biological, and physical systems at a constant pressure. | ||
| + | Enthalpy formula: H = U + pV. | ||
| + | Where: H is enthalpy of the system (joule) | ||
| + | U is internal energy (joule) | ||
| + | p is pressure (Pa) | ||
| + | V is volume (m^3) | ||
Revision as of 16:03, 9 March 2021
Nama: Ardaffa Kemal Rasha
NPM: 1806187890
Tempat,tanggal lahir: Tangerang, 28 Mei 2000
Saya adalah Mahasiswa Fakultas Teknik Universitas Indonesia, Program Studi Teknik Mesin KKI angkatan 2018. Saat ini Saya sedang menempuh perkuliahan di semester 6 dan alasan Saya mengambil Program Studi (Prodi) Teknik Mesin karena ketertarikan saya di bidang permesinan, dan juga dengan harapan bahwa saya dapat bekerja di bidang Teknik Mesin setelah lulus dari Universitas Indonesia. Minat saya di bidang Teknik Mesin adalah di bidang otomotif, ayah saya yang merupakan lulusan Teknik Mesin UI juga berperan besar dalam ketertarikan saya untuk kuliah dan belajar di Teknik Mesin UI.
23 Febuari 2021
Hari ini saya merasa sehat dan bahagia, walaupun saat kelas ECS saya mengalami masalah internet sehingga koneksi terputus-putus sehingga saya kurang menangkap materi, tetapi teman-teman sekelas saya sudah mengajarkan materi hari ini setelah kelas agar saya tidak ketinggalan materi.
Secara simple, Energi adalah daya yang dapat digunakan untuk melakukan berbagai proses kegiatan. Ketika saya harus menjelaskan kepada anak SD apa itu energi. Saya akan menggunakan analogi bahwa energi adalah makanan yang manusia perlukan untuk melakukan aktifitas sehari-hari seperti belajar dan bekerja.
24 Febuari 2021
Pada pertemuan hari ini, kami memulai kelas dengan presentasi dari setiap mahasiswa mengenai wikipage mereka yang berisi tentang diri mereka dan review kelas hari kemarin. Kami juga mendapat pengenalan mengenai software OpenModelica. Tugas: Latihan dan lancarkan penggunaan OpenModelica
2 Maret 2021
Pada pertemuan hari ini kami memberi opini mengenai apa itu konservasi energi menurut kami, serta kami mempelajari rumus-rumus yang dapat digunakan di OpenModelica. Selain itu kami juga mendapat penjelasan mengenai OpenModelica oleh teman kami Zakaria Bustami.
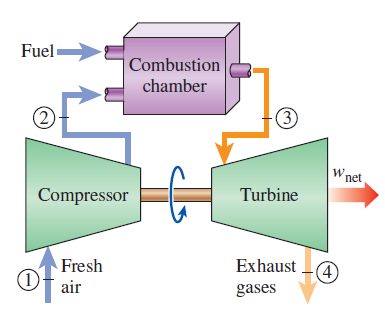
The Brayton cycle is a thermodynamic cycle named after George Brayton that describes the workings of a constant-pressure heat engine. Brayton Cycle can be summarized into 4 internally reversible process:
1-2 Isentropic compression (in a compressor)
2-3 Constant-pressure heat addition
3-4 Isentropic expansion (in a turbine)
4-1 Constant-pressure heat rejection
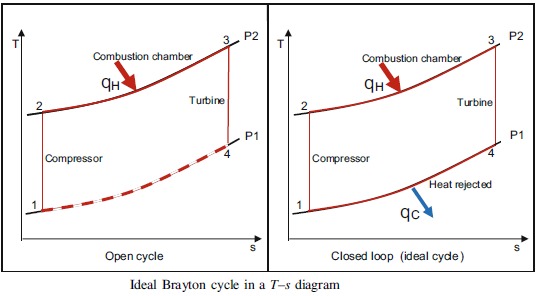
Ideal Brayton cycle:
isentropic process – ambient air is drawn into the compressor, where it is pressurized. isobaric process – the compressed air then runs through a combustion chamber, where fuel is burned, heating that air—a constant-pressure process, since the chamber is open to flow in and out. isentropic process – the heated, pressurized air then gives up its energy, expanding through a turbine (or series of turbines). Some of the work extracted by the turbine is used to drive the compressor. isobaric process – heat rejection (in the atmosphere). Actual Brayton cycle:
adiabatic process – compression isobaric process – heat addition adiabatic process – expansion isobaric process – heat rejection
A temperature–entropy diagram, or T–s diagram, is a thermodynamic diagram used in thermodynamics to visualize changes to temperature and specific entropy during a thermodynamic process or cycle as the graph of a curve. It is a useful and common tool, particularly because it helps to visualize the heat transfer during a process. For reversible (ideal) processes, the area under the T–s curve of a process is the heat transferred to the system during that process.
3 March 2021
On today's class we discuss about entropy and enthalpy.
Entropy is a scientific concept, as well as a measurable physical property that is most commonly associated with a state of disorder, randomness, or uncertainty. Entropy formula: ΔS = ΔQ / T where: ΔS is change of entropy (joule/kelvin)
      ΔQ is change of heat (joule)
      T is temperature (kelvin)
Enthalpy is a property of a thermodynamic system, defined as the sum of the system's internal energy and the product of its pressure and volume. It is a convenient state function standardly used in many measurements in chemical, biological, and physical systems at a constant pressure. Enthalpy formula: H = U + pV. Where: H is enthalpy of the system (joule)
      U is internal energy (joule)
      p is pressure (Pa)
      V is volume (m^3)


